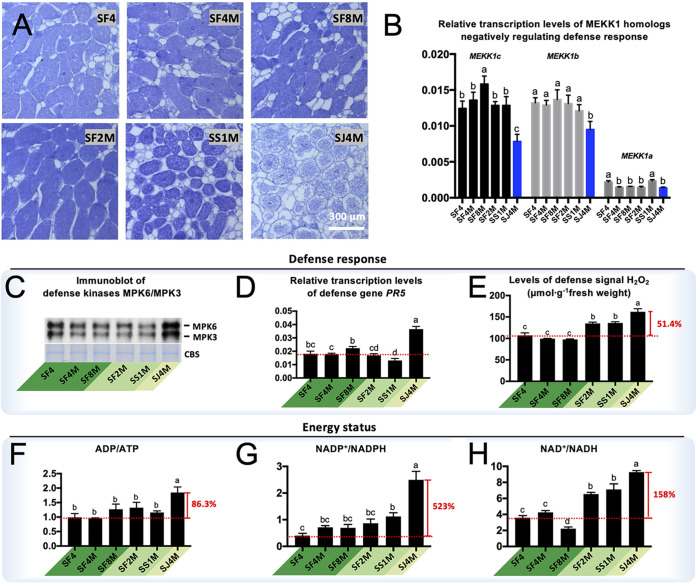
FIG 7.
Defense response and energy status in G. max cv. JD17 nodules. (A) Thin sections of nodules induced by corresponding strains. (B) Relative transcription levels of MEKK1 homologs compared to an actin gene, Gm.15G05020. (C) Immunoblotting of defense kinases MPK6/MPK3 using antibody against phosphorylated MAPK. (D) Relative transcription levels of defense response gene PR5 compared to Gm.15G05020. (E) H2O2 production. (F to H) Energy status indicated by ratios of ADP/ATP (F), NADP+/NADPH (G), and NAD+/NADH (H). Error bars represent SD from biological triplicates. Significant differences between means are indicated by different letters based on ANOVA followed by Tukey’s test (alpha = 0.05).

