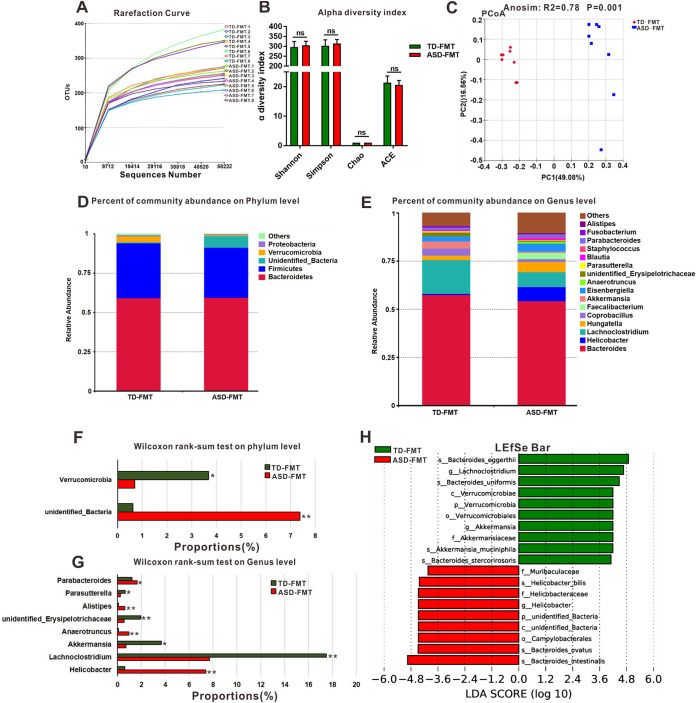
FIG 2.
Comparison of microbial characteristics of cecal contents between the TD-FMT mice (mice transplanted with the fecal microflora of typically developing donors) and ASD-FMT mice (mice transplanted with the fecal microflora of donors with autism spectrum disorder). (A and B) Rarefaction curves (A) and alpha diversity indices (B) of cecal samples from TD-FMT and ASD-FMT mice. (C) Principal-coordinate analysis (PCoA) plots based on the unweighted UniFrac distance metrics of the cecal microbiota compositions between the two groups at the operational taxonomic unit (OTU) level. Anosim, analysis of similarity. (D and E) Percentages of community abundance in the TD-FMT and ASD-FMT mice at the phylum (D) and genus (E) levels. (F and G) Comparison of the dominant microflora at the phylum (F) and genus (G) levels between the TD-FMT and ASD-FMT mice according to the Wilcoxon rank sum test. (H) Histogram of the linear discriminant analysis (LDA) value distribution for the most abundant phylotypes of the cecal microbiota in the TD-FMT and ASD-FMT mice. *, P < 0.05; **, P < 0.01; ns, not significant (based on post hoc tests) (n = 8).

