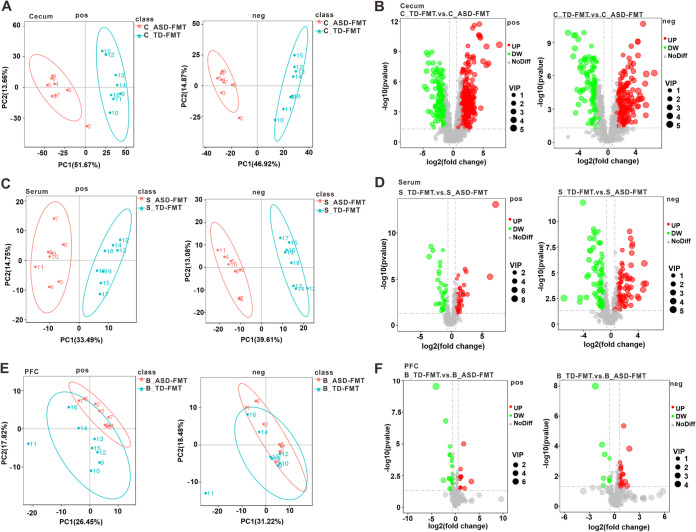
FIG 3.
Differentially abundant metabolites identified by untargeted metabolomics in different tissues of TD-FMT mice (mice transplanted with the fecal microflora of typically developing control donors) and ASD-FMT mice (mice transplanted with the fecal microflora of donors with autism spectrum disorder). (A, C, and E) Principal-component analysis (PCA) of the cecal contents (A), serum samples (C), and prefrontal cortex (PFC) samples (E) between the TD-FMT and ASD-FMT groups. (B, D, and F) Volcano plots of the altered metabolites in the cecal contents (B), serum samples (D), and PFC samples (F) between the two groups (n = 8). The abscissa represents the log2(fold change) of metabolite expression, and the ordinate represents the level of the −log10(P value). VIP, variable importance in the projection; pos, positive-ion mode; neg, negative-ion mode; UP, the upregulated metabolites in ASD-FMT group compared with TD-FMT group; DW, the downregulated metabolites in ASD-FMT group compared with TD-FMT group; NoDiff, the metabolites with no difference between TD-FMT and ASD-FMT groups.

