Fig. 2.
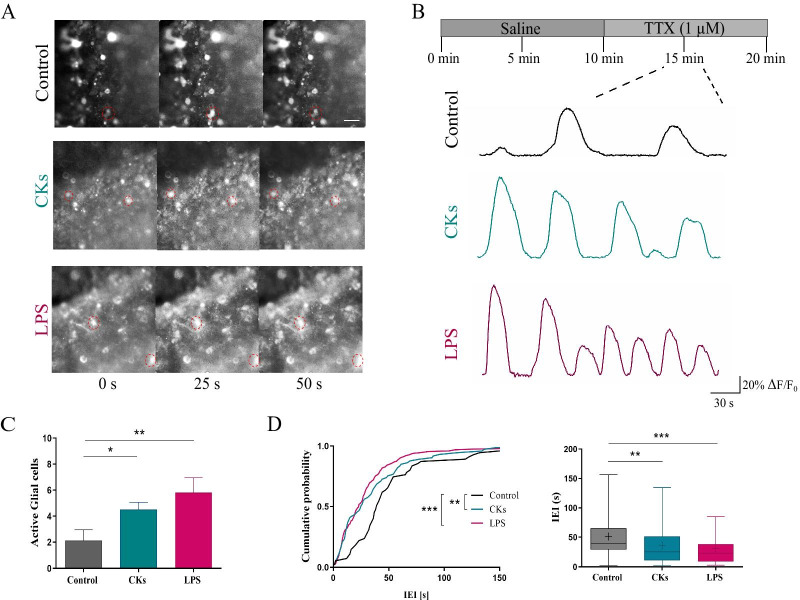
CKs and LPS enhance spinal astrocytes calcium dynamics. A Representative snapshots (40 × magnification) of the ventral area of organotypic spinal slices loaded with Fluo-4 AM (4 µM); frames were taken at variable time intervals (0, 25 and 50 s) in three different experimental conditions (Control, CKs and LPS). Scale bar 50 µm. B Representative fluorescent tracings depicting glial cells calcium oscillations in Control (black), CKs and LPS (6H, blue and purple, respectively), all recorded in the presence of TTX. C The bar plot summarizes the number of spontaneously active glial cells/field. **P < 0.01 and *P < 0.05, one-way ANOVA. D Cumulative distributions and box plot quantify the IEIs (s) of the recorded calcium activity in all conditions. ***P < 0.001 and **P < 0.01, in the cumulative plot Kolmogorov–Smirnov test and in the Box plot, Kruskal–Wallis test

