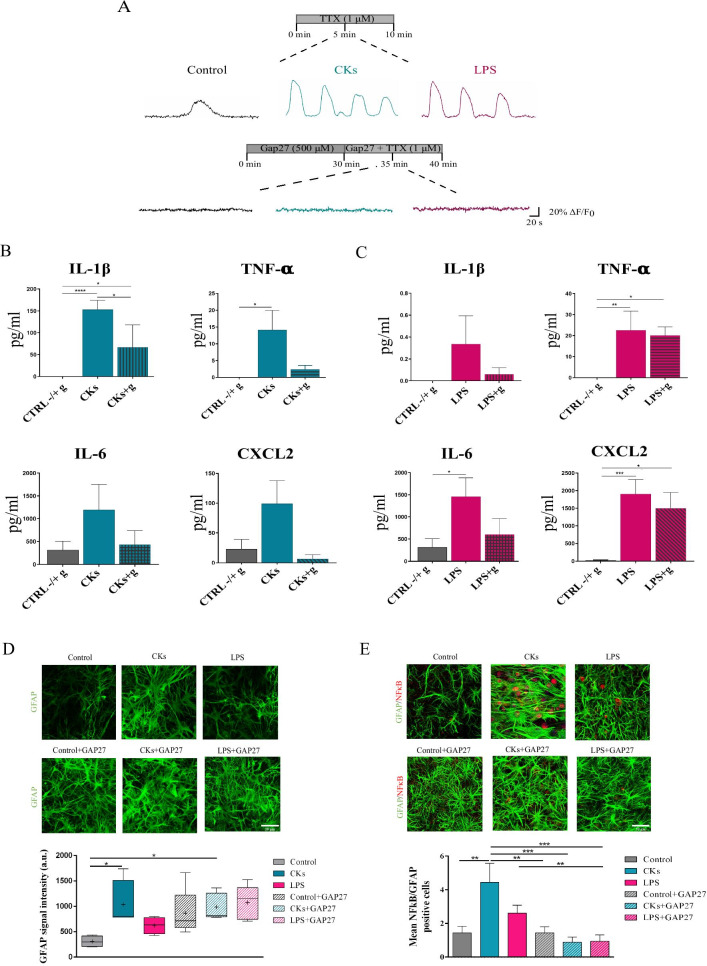
Fig. 5.
Gap27 removed calcium activity in Control, CKs and LPS astrocytes. A Representative glial cells calcium oscillations in Control (black) and after CKs and LPS (blue and purple, respectively). Upon 30 min incubation in Gap27 (500 µM) glial cells activity was completely removed in all conditions. All were performed in TTX. B Production of cytokines (IL-1β; TNF-α; IL-6) and chemokine (CXCL2) determined by Milliplex assay of organotypic culture supernatants in CKs prior and after incubation with Gap27 (CKs + g). C Production of cytokines (IL-1β; TNF-α; IL-6) and chemokine (CXCL2) determined by Milliplex assay of organotypic culture supernatants in LPS prior and after incubation with Gap27 (LPS + g). Test *P < 0.05, **P < 0.01, ***P < 0.001, ****P < 0.0001, one-way ANOVA. D Representative high magnification (60 ×) confocal micrographs of organotypic slices immunolabeled with GFAP (in green) in Control, CKs and LPS prior before (top) or after (bottom) Gap27. GFAP intensity in all conditions is summarized in the box plot. *P < 0.05, Kruskal–Wallis test. E Representative high magnification (60 ×) confocal micrographs of organotypic slices co-immunolabeled with GFAP (in green) and NFκB p65 (in red) in Control, CKs and LPS prior (top) or after (bottom) Gap27. The bar plot summarizes the mean number of GFAP/NFκB p65 positive cells in all conditions. **P < 0.01, ***P < 0.001; one-way ANOVA and Mann–Whitney non parametric t-test

