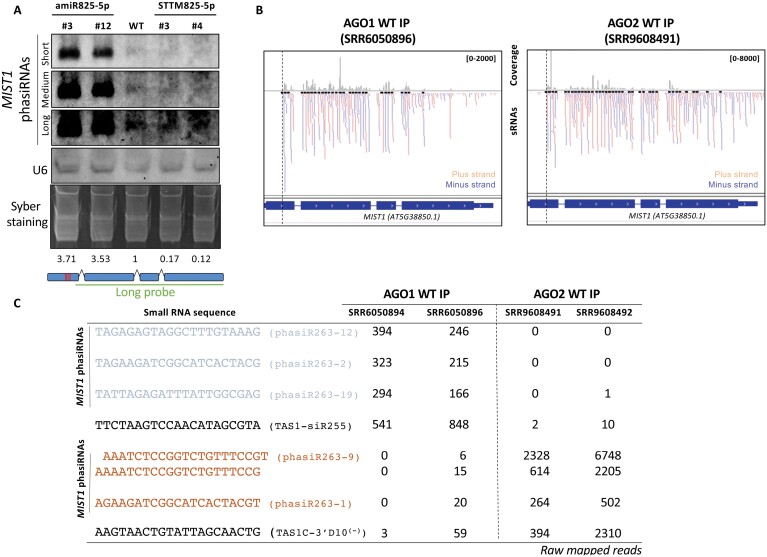
Fig. 5.
MIST1-derived phasiRNAs accumulate according to miR825-5p levels and are loaded onto AGO1 or AGO2 complexes. (A) Small RNA northern blot analysis of MIST1-derived phasiRNAs in amiR825-5p and STTM825-5p transgenic plants compared with the wild type (WT). U6 and Syber staining are used to control for loading. Three different exposures are shown. Normalized values in relation to WT levels calculated for each lane using ImageJ are shown below the corresponding lane. The long probe corresponding to the length of the gene used is also shown. Similar results were obtained in two biological replicates. (B) IGV screenshot showing production of sRNAs from the MIST1 genomic region that are pulled down with AGO1 and AGO2 complexes. Corresponding libraries are indicated. (C) The table shows raw mapped reads for MIST1-derived most abundant phasiRNAs in AGO1/AGO2 pull-down experiments. Corresponding libraries are indicated. Well-established secondary tasiRNAs generated from TAS1 genes are included as references.

