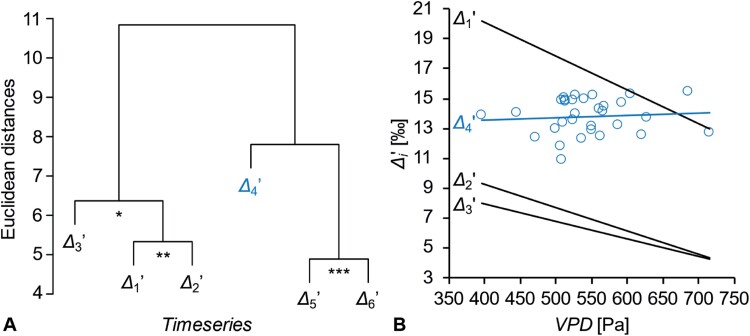
Fig. 3.
Hierarchical clustering of Δ i′ time series due to temporal co-variability. Members of clusters marked by asterisks are significantly correlated at the following significance levels: P≤0.05 (*), 0.01 (**), and 0.001 (***). (B) Relationships between Δ i and growing season air vapour pressure deficit (VPD; March to November). Ordinary least squares regression models show significant negative relationships between VPD and Δ 1′, Δ 2′, and Δ 3′ (Δ 1′= –0.0226VPD+29.1, R2=0.46, P<0.0001; Δ 2′= –0.0156VPD+15.5, R2=0.24, P<0.01; Δ 3′= –0.0116VPD+12.6, R2=0.26, P<0.01) but not Δ 4′ (Δ 4′=0.0016VPD+12.9, R2=0.007, P>0.6). Δ i′ denotes time series of intramolecular 13C discrimination corrected for heterotrophic triose phosphate cycling (Wieloch et al., 2018). Blue: time series discussed here. Data obtained from tree-ring glucose of Pinus nigra laid down from 1961 to 1995 at a dry site in the Vienna basin (n=31). To avoid cluttering, only Δ 4′ data points are shown. Modified figure from Wieloch et al. (2018).

