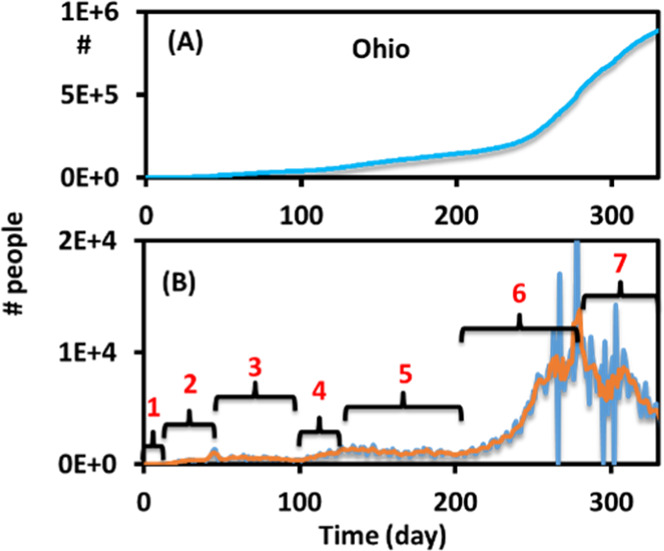
Figure 3.

(A) Example raw data (state of Ohio) of the accumulated positive test cases (N–S) vs time. (B) Tested positive cases per day (−ΔS) and an overlay of the smoothed data in orange. The time is divided manually into seven pieces for the further fitting of Rt.
