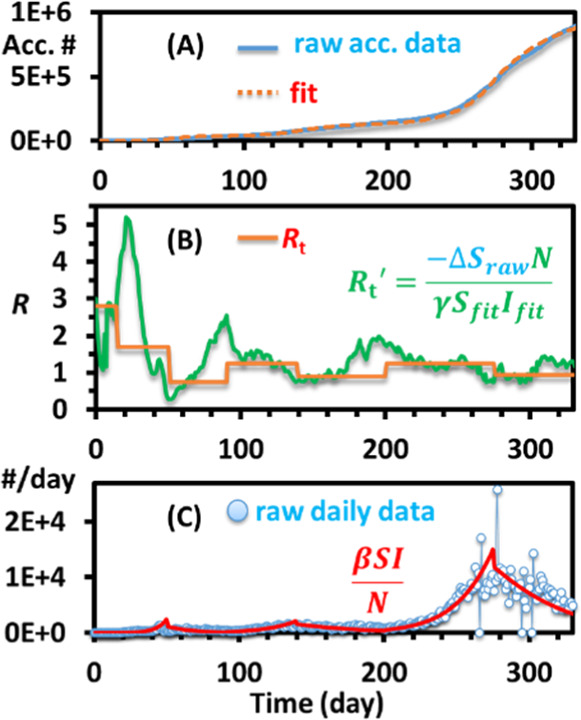
Figure 5.

(A) Manually fitted cumulative positive cases of the state of Ohio with the piecewise guesses of Rt, as shown in (B). (B) Averaged Rt and an estimated daily value Rt′ using the equation shown. (C) Overlay of daily positive cases raw data and the piecewise fitted curves calculated with the equation modified from eq 4.
