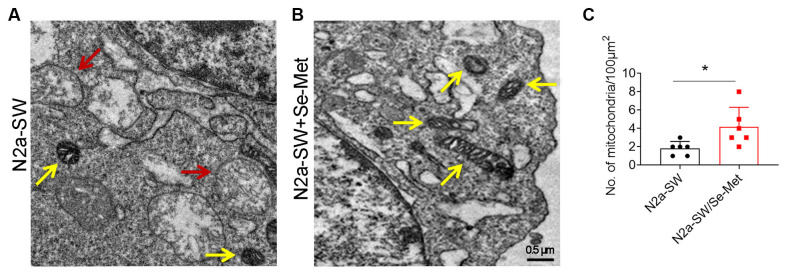
Figure 1.
The mitochondrial morphology of N2a-SW cells was observed by TEM. (A–C) Representative images and corresponding quantification of mitochondria in N2a cell line following 10 μM Se-Met treatment. The red arrow represents the vacuolization of mitochondria. The yellow arrow represents normal mitochondria. 20,000×. Scale bars, 0.5 μm. *p < 0.05 vs. the control group. n = 6 slices.

