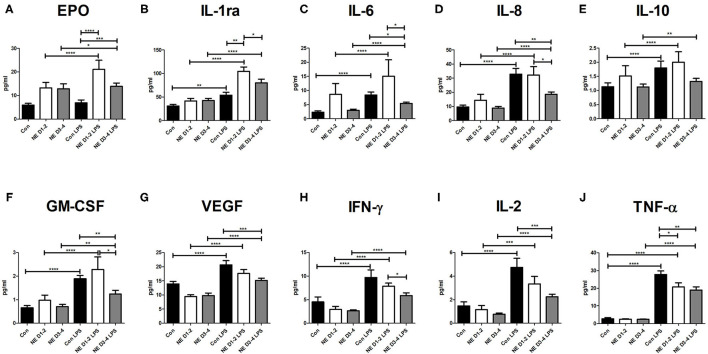
Figure 2.
Cytokine levels in NE and control after LPS stimulation. Whole blood sampling was performed in the 1st week of life, samples were stimulated with 1 μg/ml of LPS, and a 14-spot ELISA Multiplex Cytokine Array was performed. Graphs represent pg/ml of each cytokine measured in samples of control, NE days 1–2, and NE days 3–4. Cytokines measured are (A) Epo, (B) IL-1ra, (C) IL-6, (D) IL-8, (E) IL-10, (F) GM-CSF, (G) VEGF, (H) IFN-γ, (I) IL-2, and (J) TNF-α. p* = p < 0.05, p** = p < 0.01, p*** = p < 0.001, p**** = p < 0.0001. NE, neonatal encephalopathy; LPS, lipopolysaccharide; Epo, erythropoietin; IL, interleukin; GM-CSF, granulocyte-macrophage colony-stimulating factor; VEGF, vascular endothelial growth factor; IFN, interferon; TNF, tumor necrosis factor.

