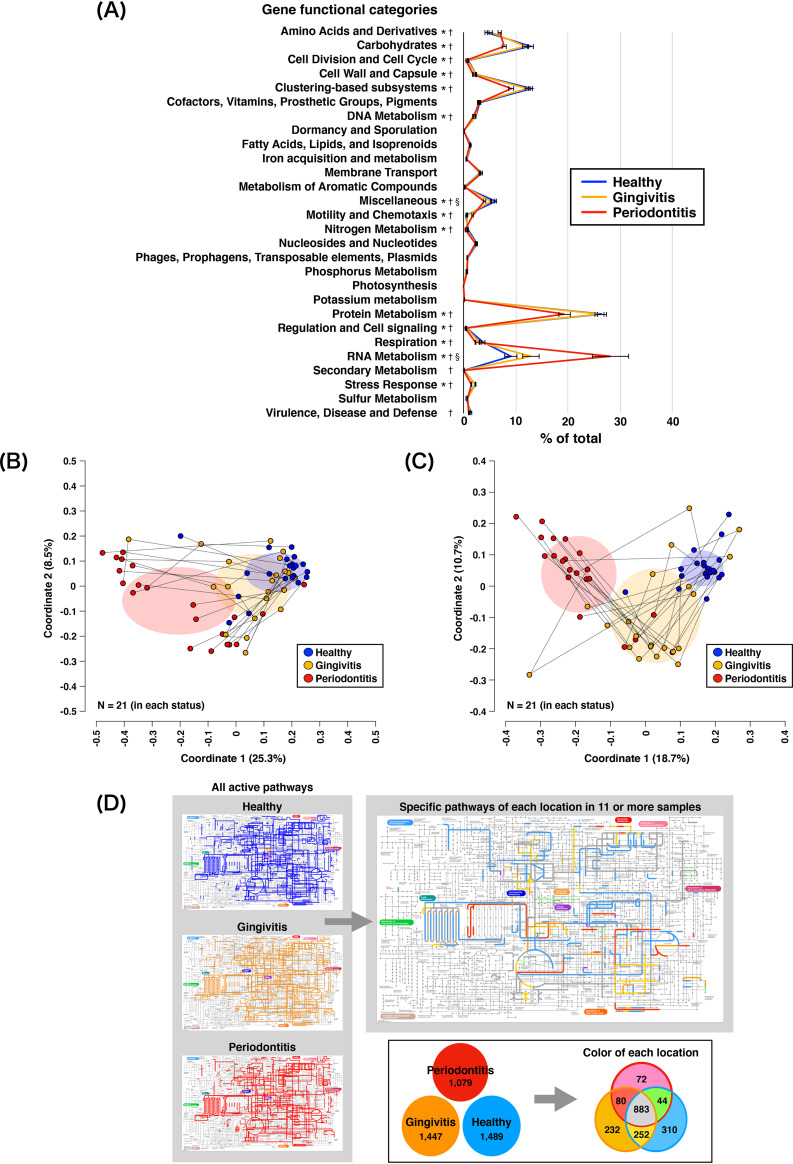
FIG 2.
mRNA profiles obtained following assignments with the SEED subsystems and the KEGG database. (A) Mean rank distributions of functional categories based on the level 1 SEED subsystems in healthy, gingivitis, and periodontitis sites. The bars show mean ± SE relative abundances. *, significant difference between gingivitis and periodontitis sites; †, significant difference between healthy and periodontitis sites; §, significant difference between healthy and gingivitis sites. (B) PCoA plot prepared from mRNA profiles assigned via the SEED subsystem analysis, as described in the legend of Fig. 1B. (C) PCoA plot prepared from mRNA profiles assigned via the KEGG database analyses, as described in the legend of Fig. 1B. (D) Active KEGG pathways present in any of the 21 samples for each periodontal status (left maps) and status-specific pathways detected in ≥11 samples (right maps), with corresponding colors in the box below.

