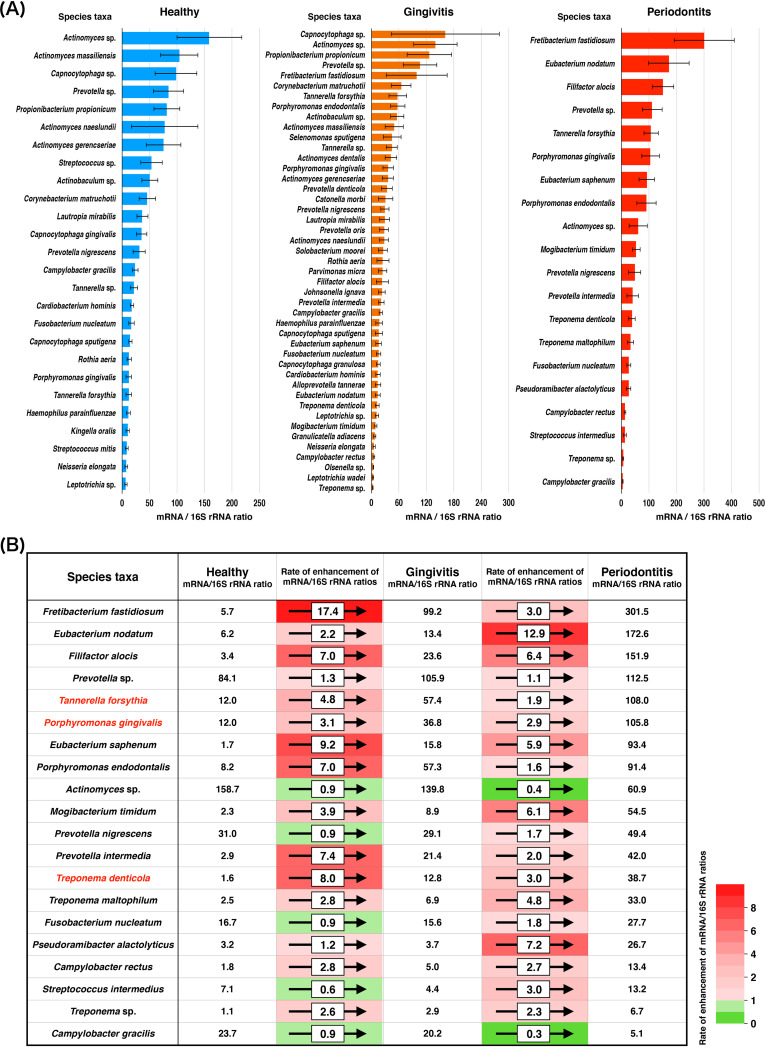
FIG 3.
Comparison of taxonomic profiles of 16S rRNA and taxonomic mRNA. (A) mRNA/rc-rRNA abundance ratios calculated for each VTiF; predominant taxa with significant differences between rc-rRNA and mRNA are shown in descending order. The bars show mean ± SE mRNA/rc-rRNA abundance ratios. (B) Comparison of mRNA/16S rRNA ratios between healthy and gingivitis sites and between gingivitis and periodontitis sites; rates of enhancement of mRNA/16S rRNA ratios for each taxon are depicted, showing significant differences in read abundance between rc-rRNA and mRNA in periodontitis sites. mRNA/16S rRNA ratios for each taxon are also depicted. Rates of enhancement of mRNA/16S rRNA ratios are indicated by color gradient. Red complex taxa are indicated in a red font.

