. 2021 Sep 21;21(21):4177–4195. doi: 10.1039/d1lc00092f

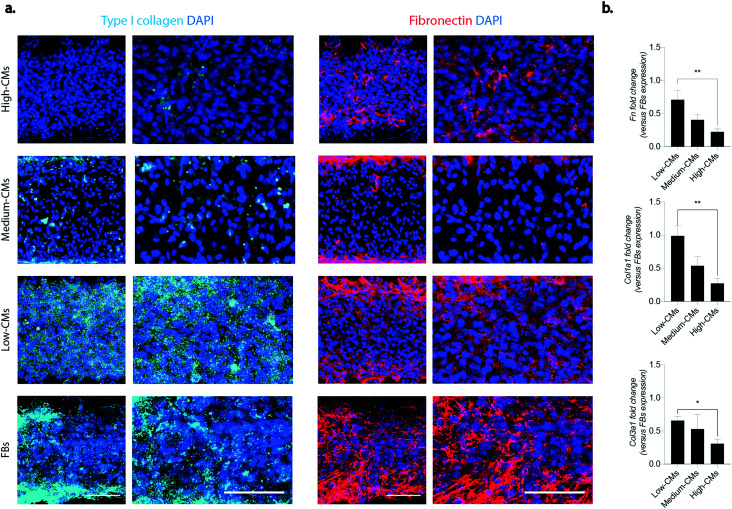
Fig. 5. Matrix deposition. a. Immunofluorescence of matrix components: type I collagen (in cyan) and fibronectin (in red). DAPI staining for nuclei is represented in blue. Images with a higher magnification are represented on the right of both columns. Scale bar 100 μm. At least four areas belonging to two biologically independent samples were considered. b. Relative gene expression of Col1a1, Col3a1 and fibronectin quantified by RT-qPCR. b-Actin was adopted as the housekeeping gene. Results were normalised to the FB population expression. *p < 0.05, **p < 0.01, ***p < 0.001 and ****p < 0.0001. Statistics by one-way ANOVA with Tukey's post hoc test for Gaussian populations and Kruskal–Wallis test with Dunn's post hoc test for non-Gaussian populations. At least N = 4 biologically independent samples were considered.

Fig. 5