. 2021 Sep 21;21(21):4177–4195. doi: 10.1039/d1lc00092f

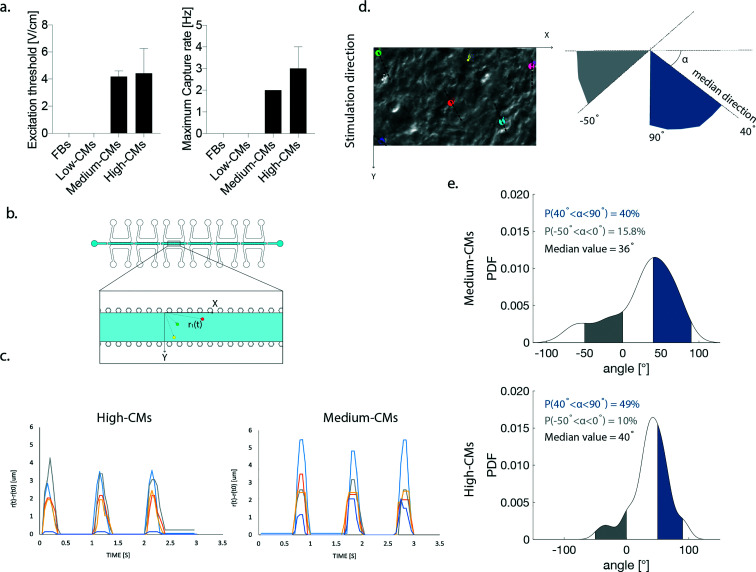
Fig. 7. Evaluation of contraction functionality of constructs. a. ET and MCR measured in the high and medium-CM conditions. Statistics by the Mann–Whitney test for non-Gaussian populations. (p > 0.05). b. Schematization of the coordinate reference system used in the assessment of beating synchronicity and contraction direction. Example position-vectors connecting the origin with three cells highlighted by coloured dots are displayed. c. Synchronicity of beating. Coloured lines represent the variation in the position vector modulus in time. Peaks corresponding to contraction demonstrate that cells beat synchronously in both conditions. d. Example of highlighted cells (coloured dots) used for the determination of the orientation angle. The direction along which each cell beats is highlighted by the dotted line. A schematization of the orientation along which cells contract is depicted on the right. e. Probability density function (PDF) of the contraction direction calculated for the high-CM and the medium CM conditions. Areas of alignment to the stimulation direction and opposite to it are highlighted in blue and grey, respectively.

Fig. 7