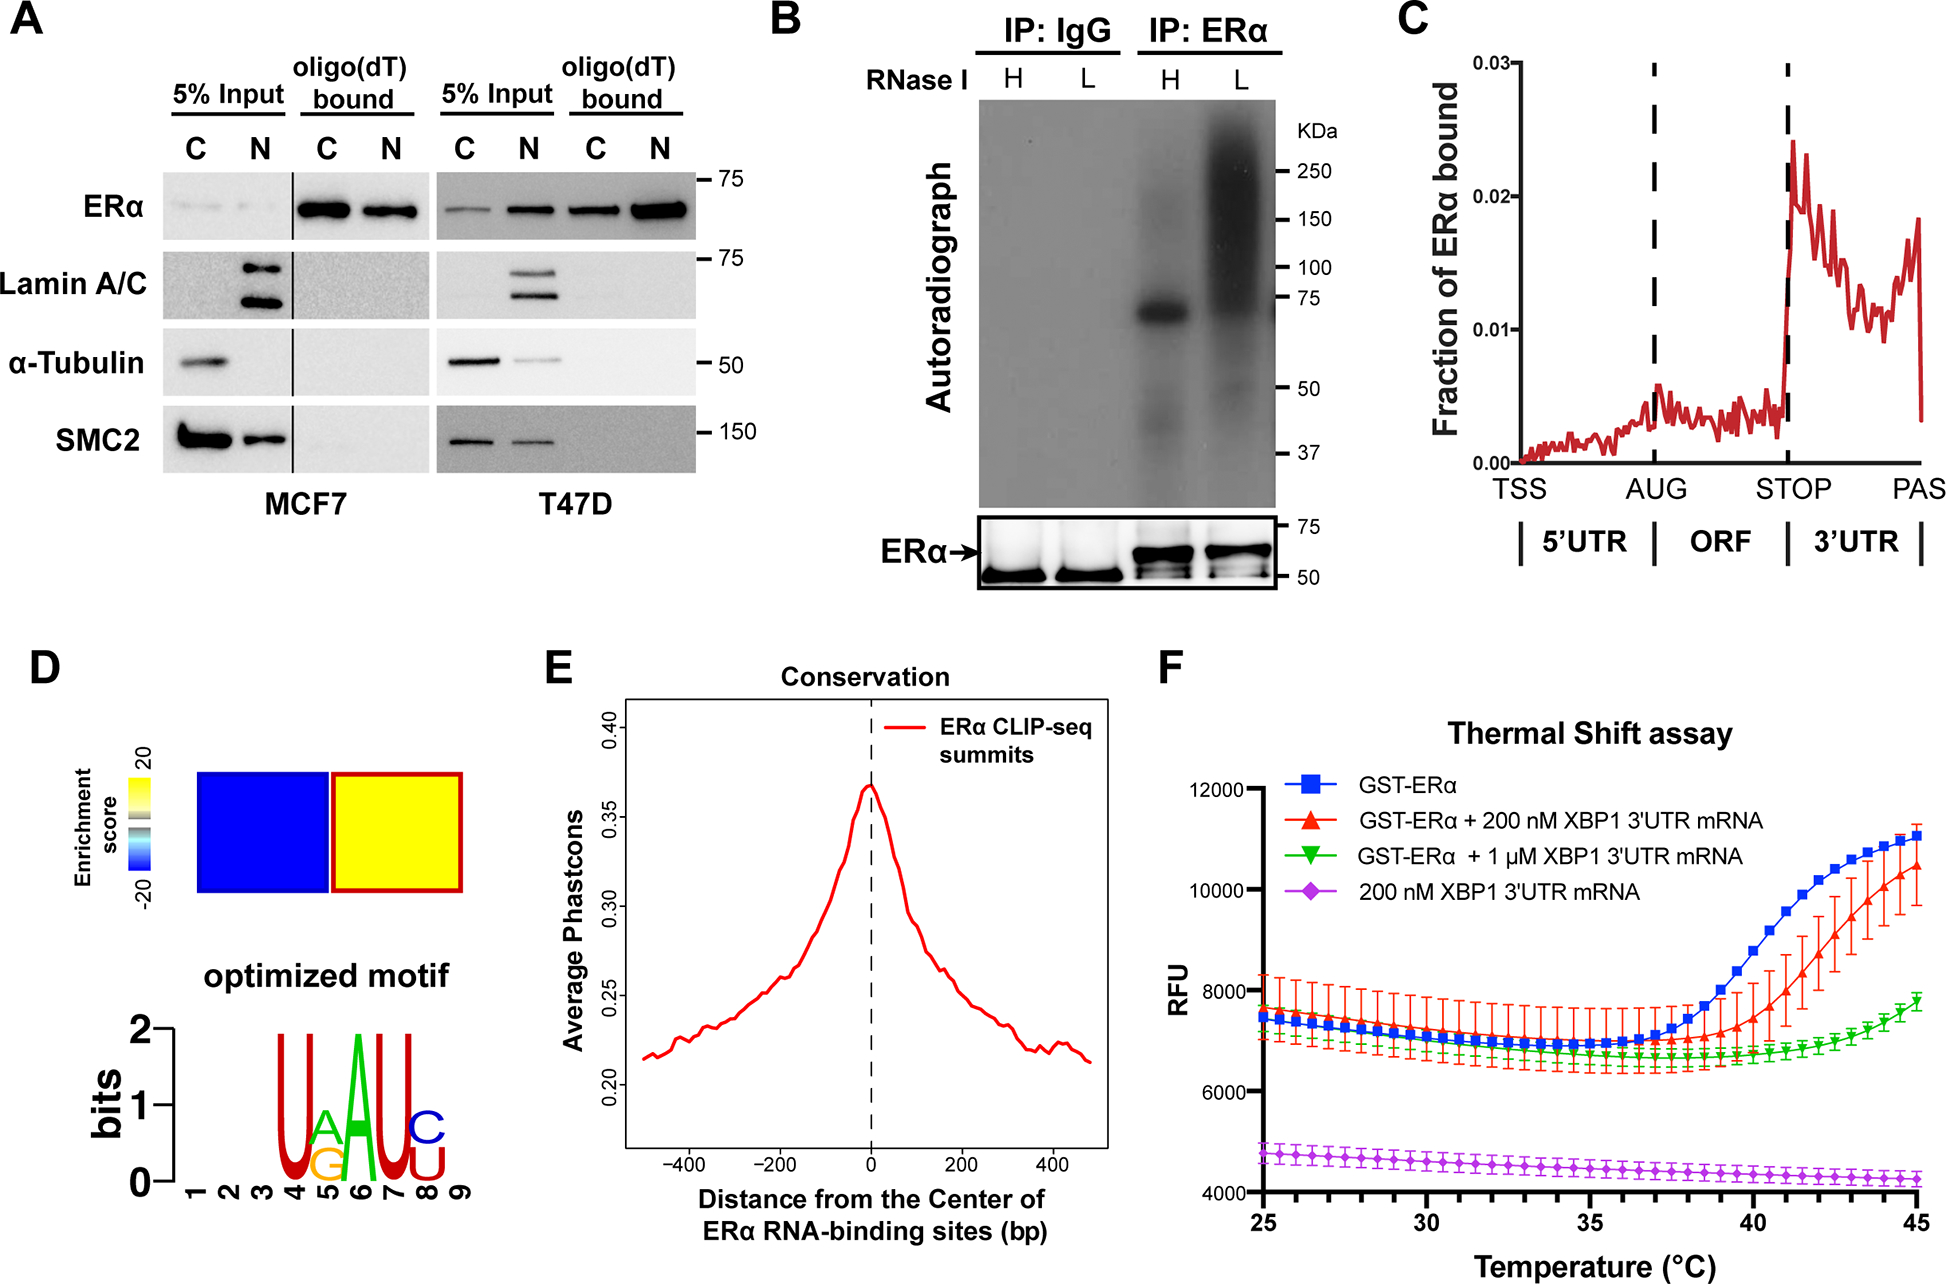
Figure 1. ERα binds to RNA directly.

See also Figure S1.
(A) Representative western blots for ERα bound to Oligo(dT) beads in cytoplasmic (C) and nuclear (N) MCF7 and T47D human breast cancer cell lysates. Internal controls: Lamin A/C (N) and α-tubulin (C), and a DNA-binding protein SMC2 is used as a negative control for RNA-binding.
(B) Autoradiogram of 32P-labelled RNA crosslinked to endogenous ERα, showing ERα-RNA complexes shifting upwards from the size of ERα (66 KDa). RNA was partially digested using Low (L) or High (H) concentration of RNase.
(C) Distributions of ERα binding events on indicated mRNA regions. TSS: transcription starting sites; AUG: translation start codon; STOP: translation stop codon; PAS: Polyadenylation signal.
(D) Heatmap (upper panel) showing the enrichment of a sequence motif (lower pannel) in the 3’ UTRs of ERα-bound mRNAs.
(E) Phastcons conservation scores of ERα-bound RNA sequence compared with their adjacent regions. The window represents ±0.5 kb regions from the center of the ERα RNA-binding site.
(F) Thermal shift assay employing GST-ERα and in vitro transcribed 3’UTR fragment of XBP1 mRNA (unspliced isoform, 1–400 nt) at different concentrations. Protein melting temperature assessed by raw fluorescence (RFU) by real-time PCR.
N=3 biological replicates.
