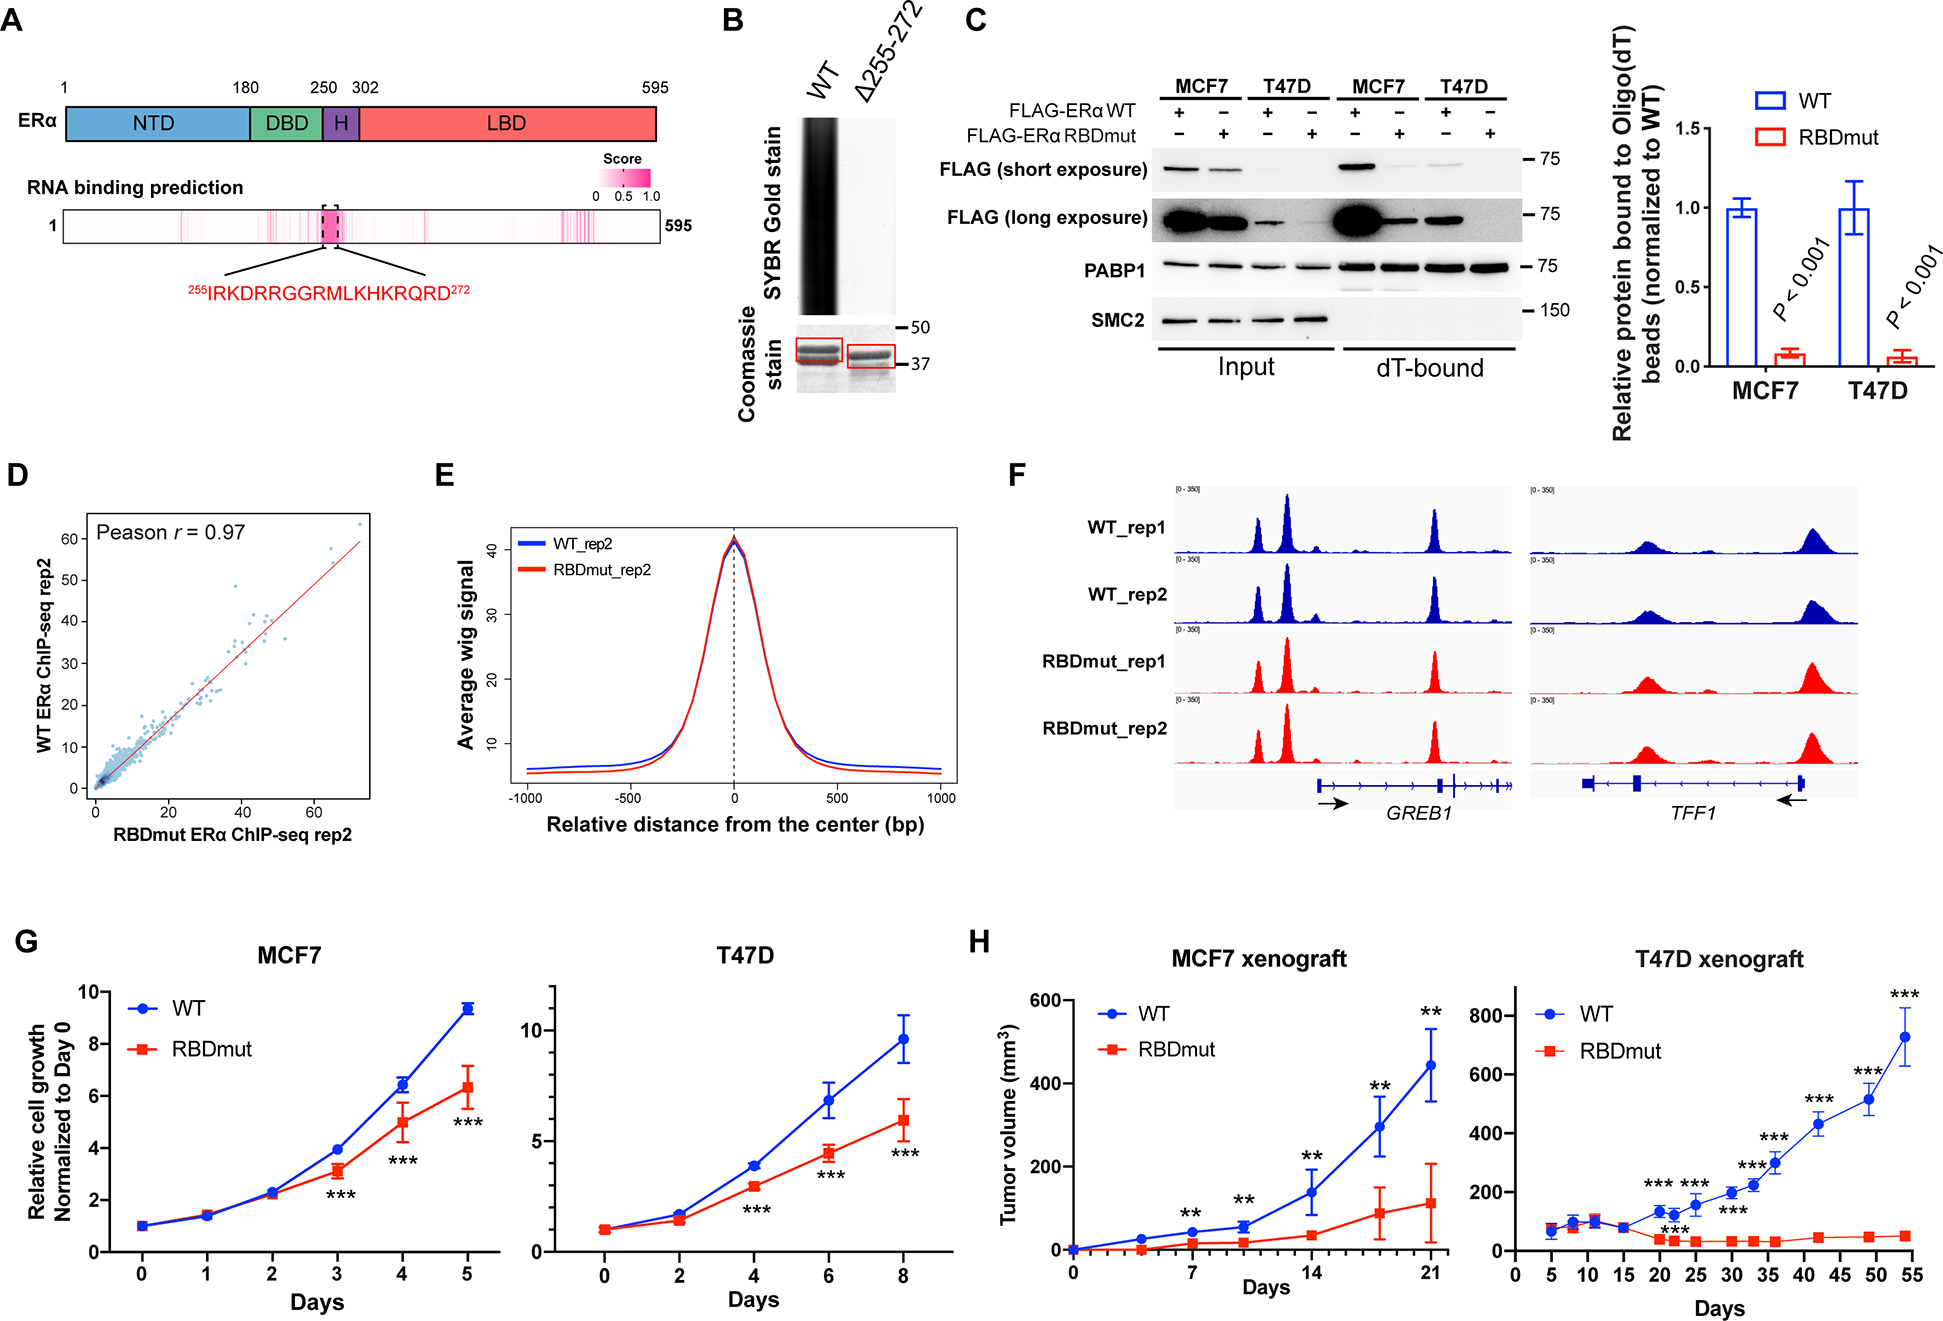
Figure 2. ERα RNA-binding activity is a key determinant of its oncogenic role in breast cancer.

See also Figure S2.
(A) Prediction of the RNA-binding domain (RBD) using the RNABindRPlus tool. NTD: N-terminal domain; DBD: DNA binding domain; H: Hinge domain; LBD: Ligand binding domain. Pink entries correspond to sequence with high prediction score of RNA-binding.
(B) SYBR Gold stain of Trizol-purified RNAs pulled down by GST-ERα protein [amino acids (aa) 144–314] with or without the putative RBD (aa 255–272). Coomassie stain of GST-purified ERα is shown.
(C) Left: Representative western blots for FLAG-ERα bound to Oligo(dT) beads in MCF7 and T47D cells with the RBD mutation of ERα (FLAG-ERα RBDmut, aa 259RRGG > 259AAAA), compared to those with wild-type (WT) ERα. PABP1 and SMC2 are used as positive and negative controls for RNA-binding respectively. Right: Quantifications are shown.
(D) The correlation of FLAG-ERα chromatin-binding signals using ChIP-seq wiggle files of MCF7 cells stably expressing WT or RBDmut ERα.
(E) The comparison of WT and RBDmut ERα enrichments around WT ERα ChIP-seq peaks using the SitePro tool (cistrome.org/ap).
(F) Integrative Genomics Viewer (IGV) views of WT and RBDmut ERα binding to GREB1 and TFF1 in MCF7 cells.
(G) Relative cell growth of MCF7 (left) and T47D (right) breast cancer cells with WT or RBDmut ERα measured by sulforhodamine B (SRB) assay.
(H) Tumor volumes of mouse xenografts implanted with MCF7 (left) and T47D (right) cells harboring WT or RBDmut ERα. N=5 mice per arm.
All values represent the mean ± SD. Two-sided t-test. Otherwise noted, N=3 biological replicates, ** P < 0.01, *** P < 0.001.
