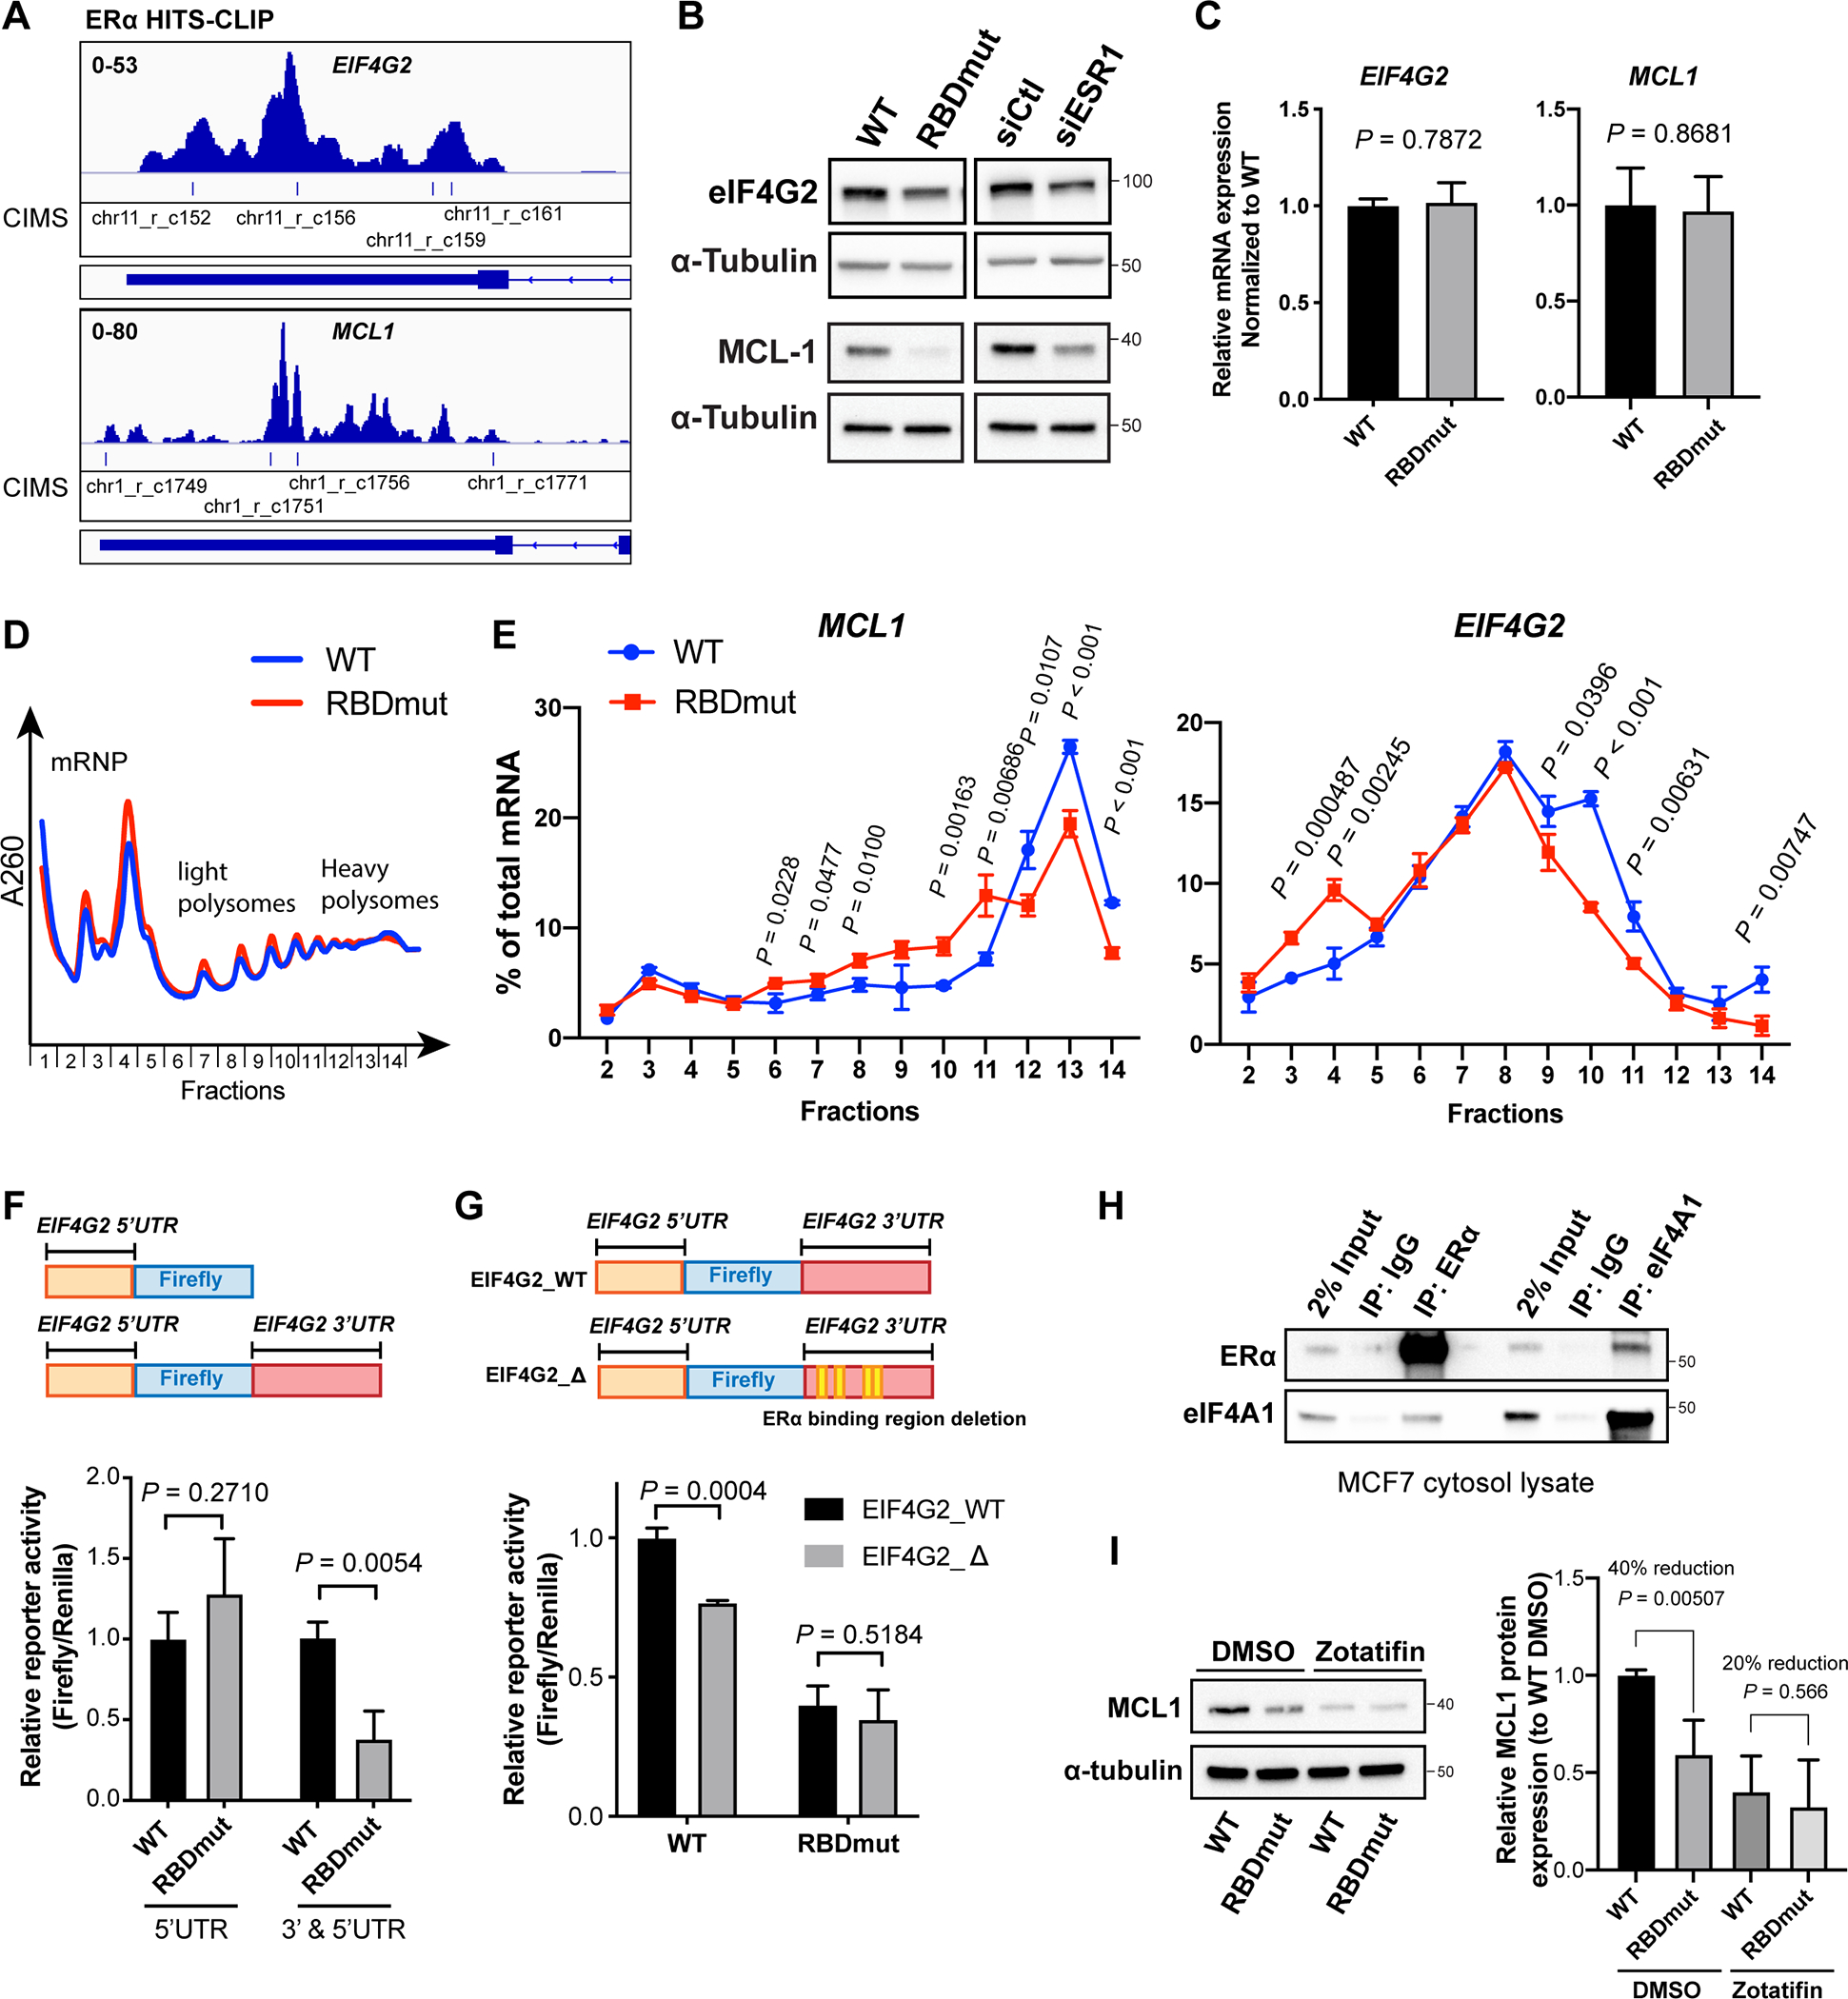
Figure 5. ERα RNA-binding increases the translation of eIF4G2 and MCL1 mRNA, and its targeting abrogates cell survival and reverses tamoxifen resistance.

See also Figure S5.
(A) IGV views of ERα HITS-CLIP analysis showing ERα binding to eIF4G2 and MCL1 mRNAs with indicated CIMS representing ERα-bound regions.
(B) Representative western blots for eIF4G2, MCL1 and α-tubulin in MCF7 cells with WT or RBDmut ERα, or with and without ERα silencing (siESR1) for 72 h.
(C) Relative mRNA expressions of eIF4G2 and MCL1 in MCF7 cells with WT or RBDmut ERα measured by qPCR.
(D) Representative polysome traces of MCF7 cells with WT or RBDmut ERα. Fractions 2–5: mRNA ribonucleoprotein (mRNP)/monosome; Fractions 6–10: light polysome; Fractions 11–14: heavy polysome.
(E) Percentages of MCL1 (left) and EIF4G2 (right) mRNAs distributed in each fraction against total mRNA of them are shown.
(F) Relative reporter activities of eIF4G2 (5’UTR)-luciferase and eIF4G2 (3’ and 5’UTR)-luciferase in MCF7 cells with WT or RBDmut ERα.
(G) Relative reporter activities of eIF4G2 (3’ and 5’UTR)-luciferase with the deletion of ERα-binding sequences (EIF4G2_Δ) compared to WT (EIF4G2_WT) in MCF7 cells with WT or RBDmut ERα.
(H) Representative western blots for eIF4A1 and ERα immunoprecipitated (IP) by ERα, eIF4A1 and IgG antibodies.
(I) Left: representative western blots for MCL1 and α-tubulin in MCF7 cells with WT or RBDmut ERα treated with eIF4A inhibitor Zotafitin for 6 h; Right: quantifications of relative MCL1 protein abundances normalized to α-tubulin from independent experiments.
N=3 biological replicates. Two-sided t-test. All values represent the mean + SD.
