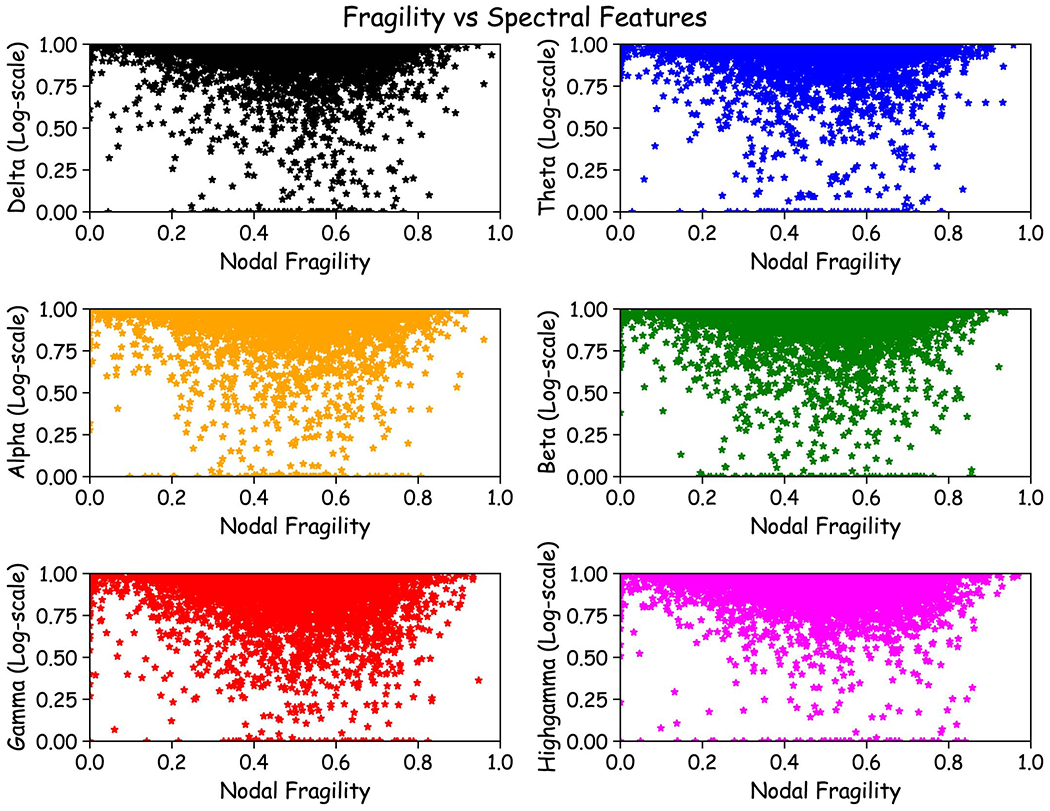
Extended Data Fig. 8. Neural fragility vs frequency power values.

Neural fragility vs frequency power values - Fragility versus frequency power in the delta, theta, alpha, beta, gamma and highgamma band for Patient_01, Patient_26, and Patient_40. For band definitions, refer to Methods - Baseline features - spectral features. Every point represents the spectral power and neural fragility value from a randomly chosen window and electrode from one of the patients. No significant correlation is seen or computed from the data. Each spectral feature and fragility are normalized as described in Methods.
