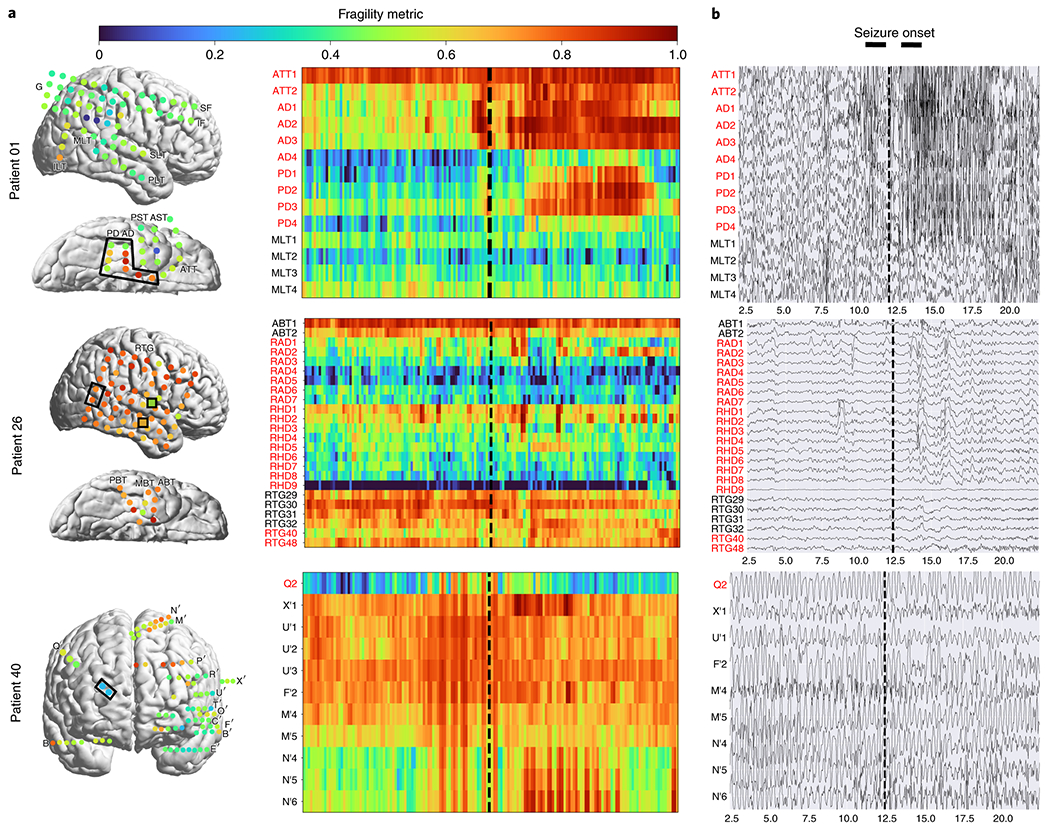
Figure 4: Fragility heatmaps, and corresponding raw EEG traces of successful and failed outcome patients.

(a) From top to bottom, Patient_1 (success, NIH treated, CC1, Engel score 1), Patient_26 (failure, JHH treated, CC3, Engel score 4), and Patient_40 (failure, CClinic treated, CC4, Engel score 3) are shown respectively. The color scale represents the amplitude of the normalized fragility metric, with closer to 1 denoting fragile regions and closer to 0 denoting relatively stable regions. (Left) Overlaid average neural fragility value of each electrode in the window of analysis we used. Black dark squares represent a depth electrode that is not shown easily on the brain. Black lines outline where the clinicians labeled SOZ. Note in Patient_26, RAD and RHD electrodes are denoted by the squares with the color showing the average over the entire electrode. (Right) Clinically annotated heatmaps of the implanted ECoG/SEEG electrodes with red y-axis denoting SOZ contacts. The red contacts are also part of the surgical resection in these patients. Data is shown in the turbo colormap. Best seen if viewed in color. (b) Corresponding raw EEG data for each patient with electrodes on y-axis and time on x-axis with the dashed white-lines denoting seizure onset. Each shows 10 seconds before seizure onset marked by epileptologists, and 10 seconds after. EEG was set at a monopolar reference with line noise filtered out. Not all electrodes are visualized in the brain plot because channels that were deemed noisy, or in white matter were not included in analysis (for more information, see section Methods). In addition, only a select set of channels are chosen for the heatmap and time-series for sake of visualization on a page and to demonstrate select channels that demonstrated different fragility values. Each EEG snapshot is shown at a fixed scale for that specific snapshot that was best for visualization, ranging from 200 uV to 2000 uV.
