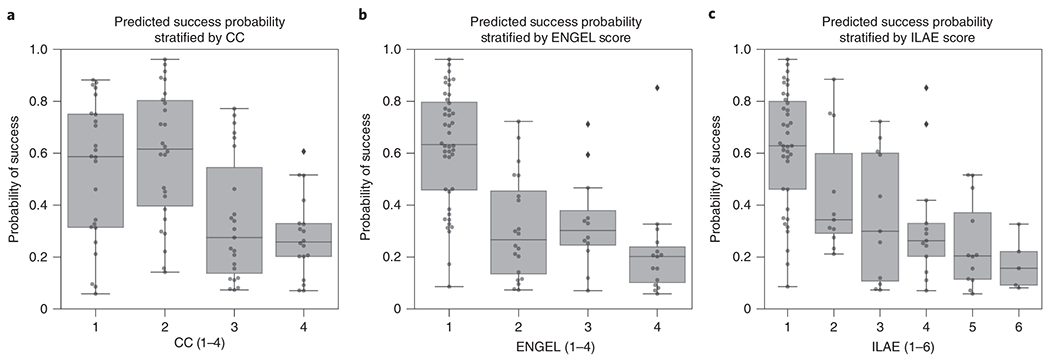
Figure 6: Neural fragility of patients stratified by clinical covariates.

(a) Distribution of success probability values per patient stratified by clinical complexity (CC; see Methods - Dataset collection), where lesional (1) and temporal lobe epilepsy (2) patients have similar distributions because they are generally the “easier” patients to treat, whereas extratemporal (3) and multi-focal (4) have lower general probabilities because they are “harder” patients to treat. It is important to note that the classification experiment posed did not explicitly optimize this separation between clinical case complexities. There is a median predicted probability of success of 0.59 (boxplot summary = 0.06, 0.88, 0.31, 0.75; min, max, first quartile, third quartile) for CC 1. For CC2, CC3, and CC4, there is a median probability of success of 0.62 (boxplot summary = 0.14, 0.96, 0.40, 0.80), 0.28 (boxplot summary = 0.07, 0.77, 0.14, 0.55), and 0.26 (boxplot summary = 0.07, 0.61, 0.20, 0.33) respectively. (b) The distribution of the probability values per patient stratified by Engel score. Due to the AUC being high for fragility, it is expected that Engel I has high predicted probability of success, while Engel II-IV have lower success probability. However, the relative downward trend in the success probabilities from Engel II-IV indicated that neural fragility is present in the clinical SOZ in varying degrees from Engel II-IV, suggesting that it correlates with the underlying severity of failed outcomes. Engel IV has the lowest average predicted probability of success as expected. Engel I, II, III, and IV subjects had a median predicted probability of success of 0.63 (boxplot summary = 0.09, 0.96, 0.46, 0.80), 0.27 (boxplot summary = 0.07, 0.72, 0.14, 0.45), 0.30 (boxplot summary = 0.07, 0.71, 0.25, 0.38) and 0.20 (boxplot summary = 0.06, 0.85, 0.10, 0.24) respectively. (c) A similar distribution for another measure of surgical outcome, the ILAE score, where 1 are considered success and 2-6 are considered failure. Here, ILAE 2-5 follow a decreasing trend with ILAE-6 having the lowest average predicted probability of success. ILAE 1-6 has a median predicted probability of success of 0.63 (boxplot summary = 0.09, 096, 0.46, 0.80), 0.34 (boxplot summary = 0.21, 0.88, 0.29, 0.60), 0.30 (boxplot summary = 0.07, 0.72, 0.11, 0.60), 0.26 (boxplot summary = 0.07, 0.85, 0.20, 0.33), 0.20 (boxplot summary = 0.06, 0.52, 0.11, 0.37), and 0.16 (boxplot summary = 0.08, 0.33, 0.09, 0.22) respectively.
