FIG 1.
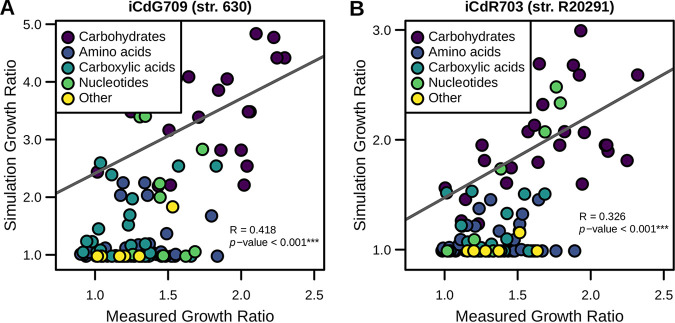
Carbon source utilization prediction profiles accurately reflect laboratory measurements. Results from previous phenotypic screen of 115 metabolites for both str. 630 and str. R20291 were compared against in silico results for each corresponding GENRE. Ratios of overall in vitro growth enhancement by each metabolite were correlated with the corresponding results from growth simulations in the same media for iCdG709 (str. 630) (A) and iCdR703 (str. R20291) (B). Points are colored by their biochemical grouping, fit, and significance determined by Spearman correlation.

