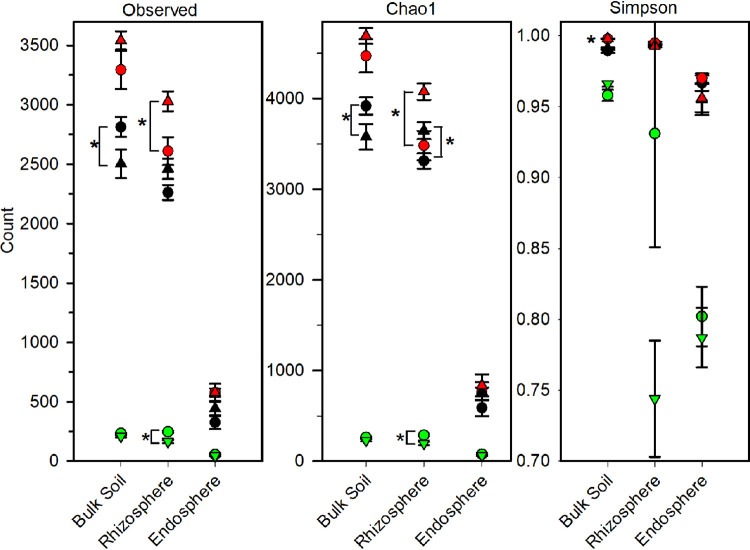
FIG 2.
Richness (observed and Chao1) and Simpson’s evenness diversity indices in bulk soil, rhizosphere, and endosphere. The prokaryote metabolically active community (red), prokaryote total resident community (black), and fungi total resident community (green) are shown. Asterisks indicate statistically significant differences between cropping systems based on a Fisher’s LSD (P < 0.05) post hoc test. While not visible, evenness in the soil prokaryotic community was greater in the diversified than the conventional cropping system. ▴, diversified; ●, conventional.

