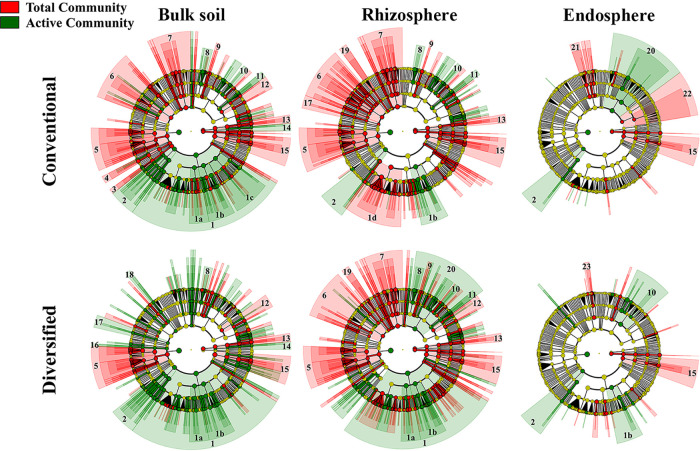
FIG 4.
LDA effect size cladograms comparing the conventional and diversified cropping system prokaryotic community profiles. Separate analyses were performed on soil, maize rhizosphere, and maize endosphere. Colored nodes and shading denote significant differences in relative abundance between specific taxons in the total (red) or metabolically active (green) community; yellow node, no significant difference. 1, Proteobacteria (1a, Betaproteobacteria; 1b, Deltaproteobacteria; 1c, Gammaproteobacteria; 1d, Alphaproteobacteria); 2, Planctomycetes; 3, Nitrospirae; 4, Gemmatimonadetes; 5, Firmicutes; 6, Chloroflexi; 7, Bacteroidetes; 8, Solirubrobacterales; 9, Rubrobacteria; 10, Frankiales; 11, Acidimicrobiia; 12, Holophagae; 13, Thaumarchaeota; 14, Euryarchaeota; 15, Verrucomicrobia; 16, Fibrobacteres; 17, Cyanobacteria; 18, Chlorobi; 19, Chlamydiae; 20, Actinobacteria; 21, Sphingobacteriia; 22, Acidobacteria; 23, Cytophagia.

