
FIG 5.
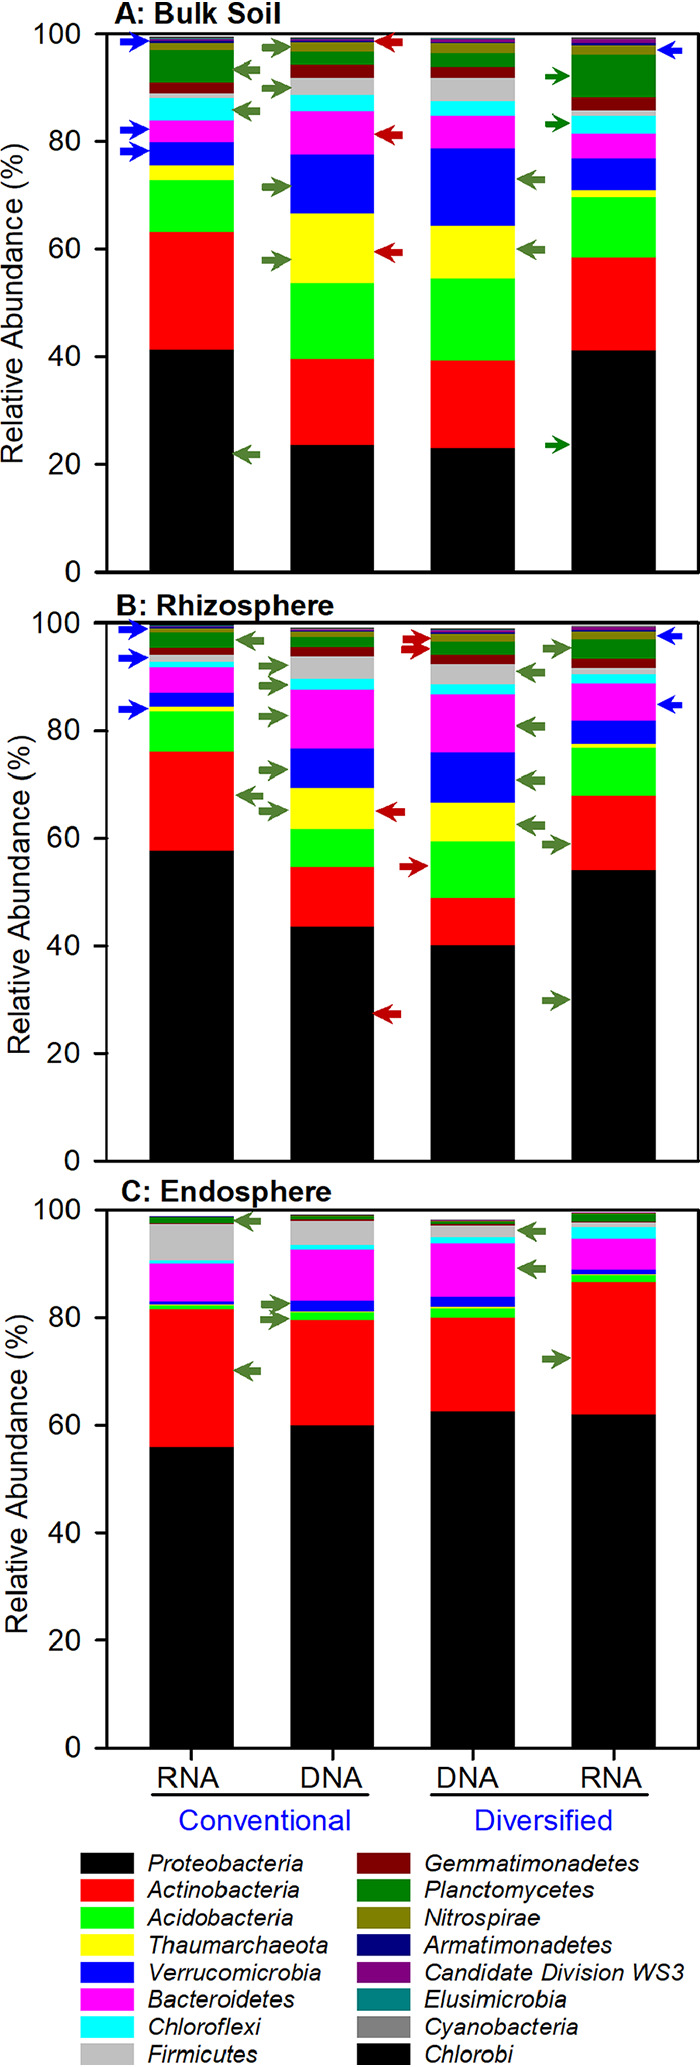
Phylum-level relative abundance of DNA- and RNA-based prokaryotic community profiles in conventional and diversified cropping systems. Red arrows identify statistically different (LDA, P < 0.05) DNA-based relative abundance between cropping systems. Green arrows indicate statistically different (LDA, P < 0.05) relative abundances between DNA- and RNA-based profiles within a cropping system. Blue arrows indicate statistically different (LDA, P < 0.05) RNA-based relative abundances between cropping systems. Low-abundance phyla are not included.