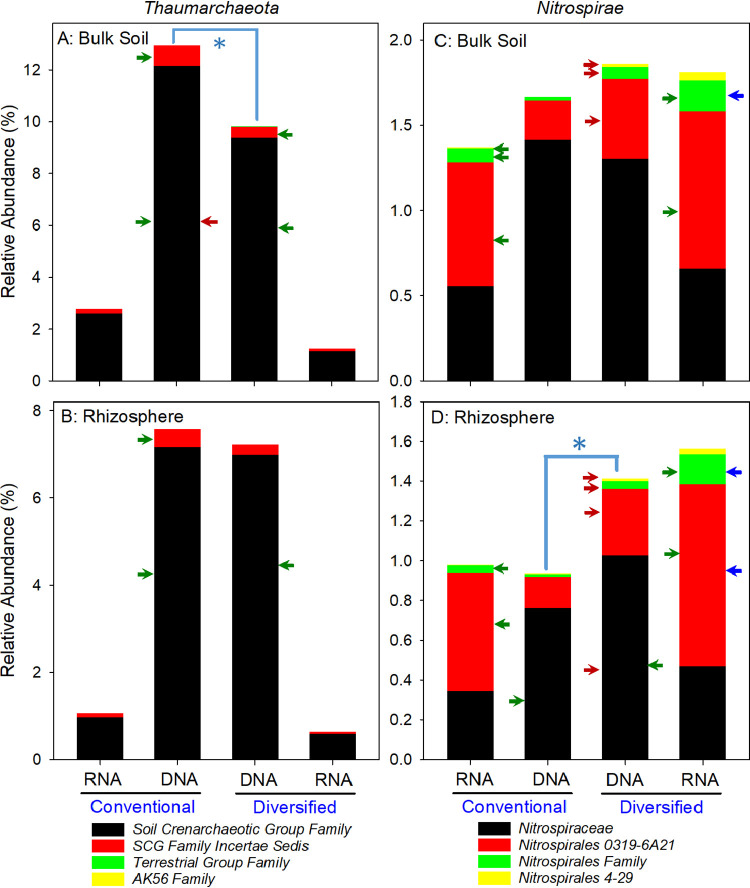
FIG 8.
DNA- and RNA-based family level relative abundance of Thaumarchaeota and Nitrospirae in bulk soil and the rhizosphere of conventional and diversified cropping systems. (A to D) Thaumarchaeota (A and B); Nitrospirae (C and D). Red, green, and blue arrows are as defined in the legend to Fig. 5. An asterisk indicates statistically significant difference at the phylum level. Low-abundance families are not visible.

