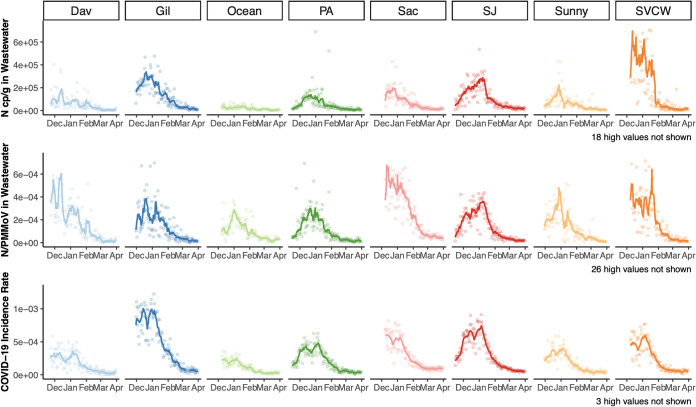
FIG 1.
Time series of (top to bottom) N copies per gram (cp/g) in wastewater, N/PMMoV, and laboratory-confirmed SARS-CoV-2 incidence rate (bottom) for each of eight POTWs and their sewersheds from mid-November/December 2020 to 31 March 2021. Points represent daily values. Lines are 7-day, centered smoothed averages. For wastewater, this is a trimmed average where the highest and lowest values from the seven day period are removed before averaging.

