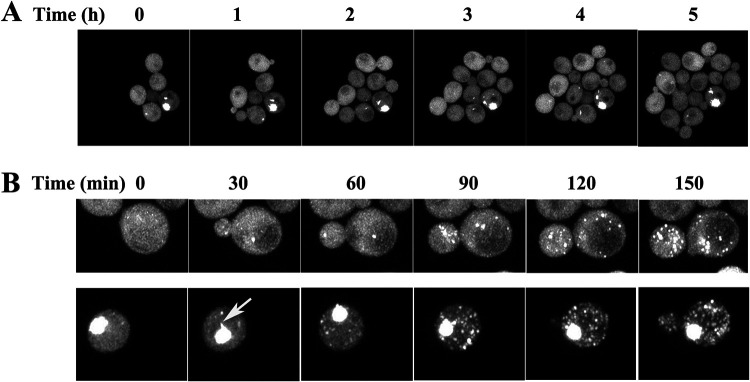
FIG 5.
Time course of the formation of HttQ103 aggregates in the absence and presence of Hsp104. (A) Time series obtained in an hsp104 deletion strain constitutively expressing HttQ103. (B) Time series obtained in an hsp104 deletion strain constitutively expressing HttQ103 following the induction of Hsp104 expression from the GAL1 promoter. (Top) No detectable aggregate was present in the cell at the start of the experiment; (bottom) a large aggregate was present in the cell at the start of the experiment. The arrow in the cell at the 30-min time point in the bottom panel indicates a flare-like projection coming off the aggregate. (See Movies S1 and S2 in the supplemental material for images acquired at 10-min intervals.) In these experiments, the yeast cells were immobilized on an agarose pad to acquire z-stack images of the same field at various times. Images are all maximized z-stacks.

