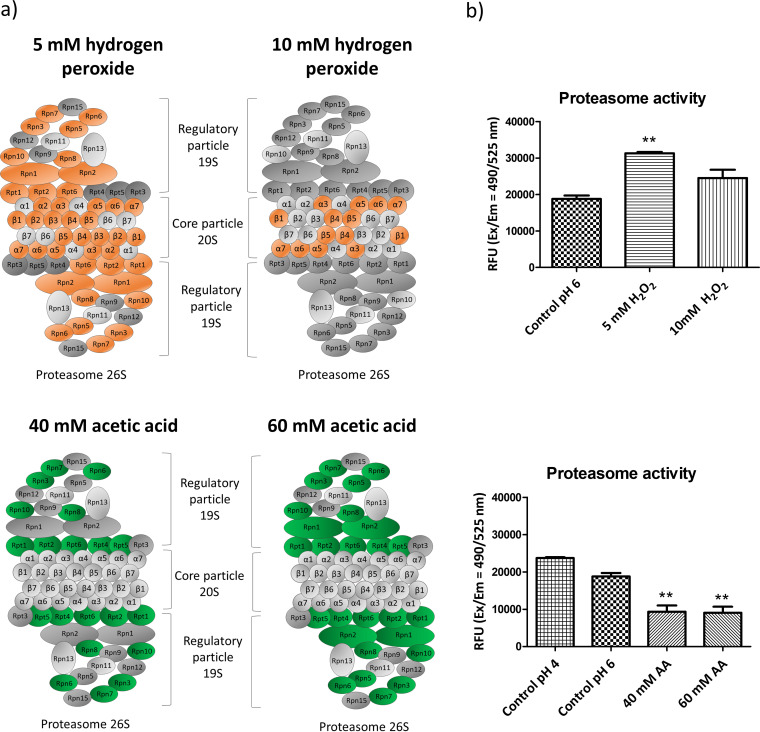
FIG 5.
Changes in the abundance of proteins from the proteasome after exposure to acetic acid or hydrogen peroxide. (a) In orange or green are highlighted proteins that increased or decreased significantly. (b) Results from the measurement of chymotrypsin-protease activity of the proteasome in relative fluorescence units (RFU).

