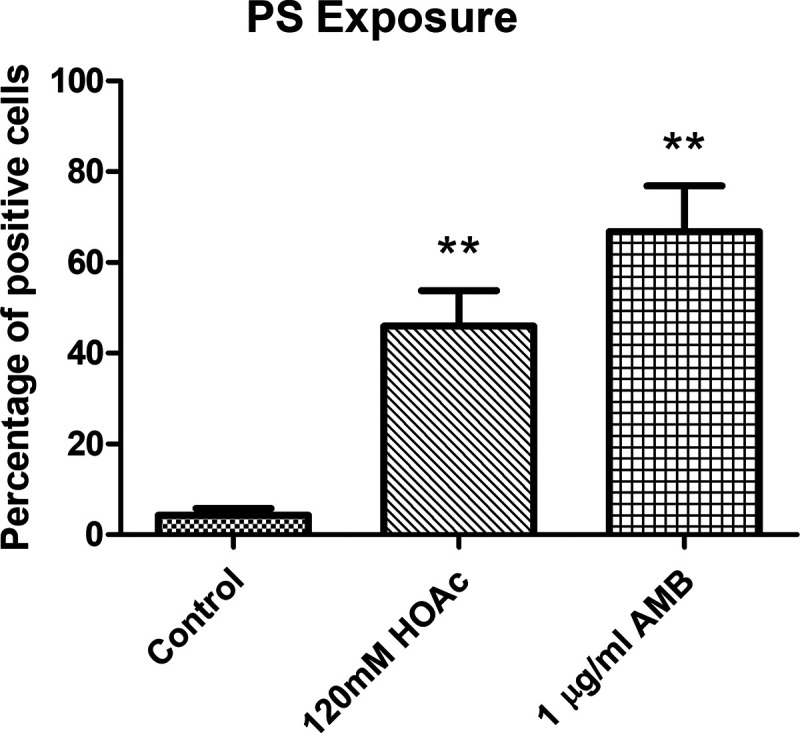
FIG 9.

Percentage of cells showing PS exposure after treatments with 1 μg/ml amphotericin B or 120 mM acetic acid compared to control samples. A significant change is indicated as follows: **, P value < 0.01 (paired t test). Results represent the means of at least three biological replicates.
