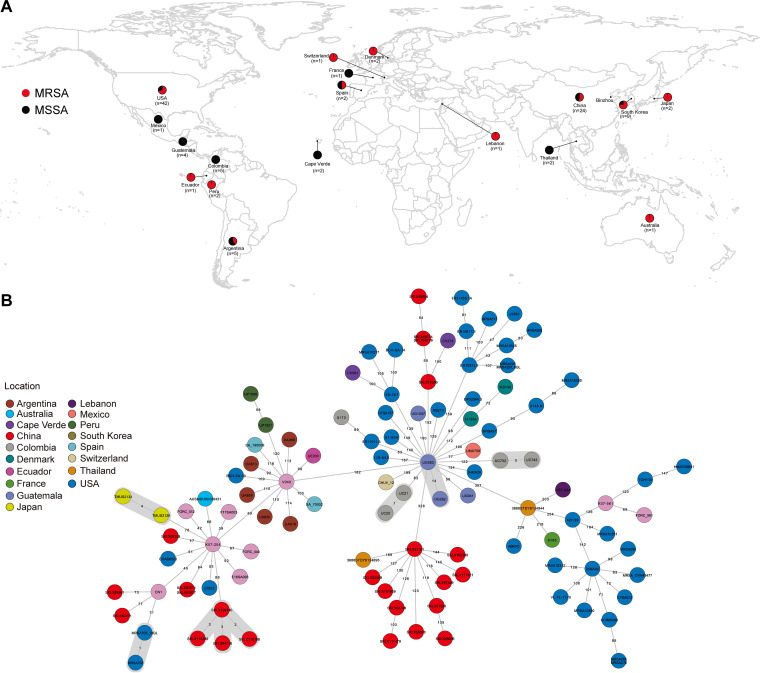
FIG 1.
Relationships among ST72 isolates in this study. (A) Geographical distribution of 107 ST72 S. aureus isolates. Red and black dots indicate MRSA and MSSA isolates, respectively. The map was created using R package ggplot2 (https://github.com/tidyverse/ggplot2). (B) MST of ST72 isolates. Each circle represents a ST72 isolate, with colors assigned according to geographic origin. The numbers on the connecting lines illustrate the number of SNPs in a pairwise comparison. The transmission cluster is marked with gray based on the threshold of 23 SNPs.

