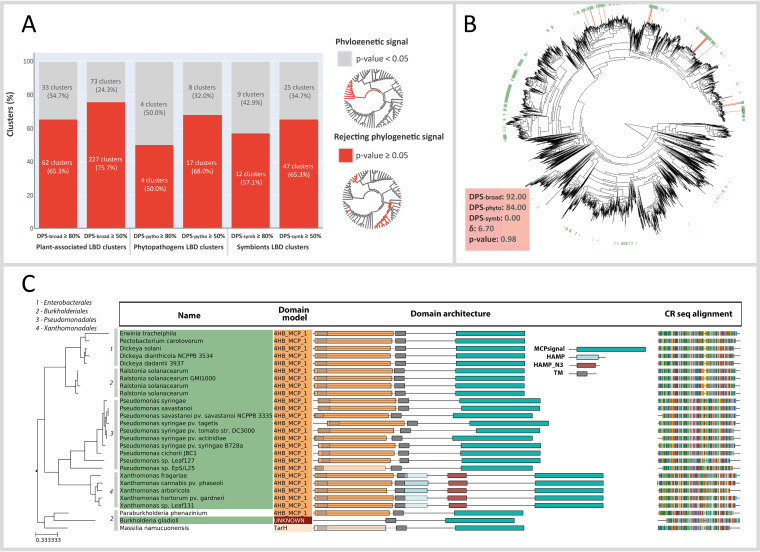
FIG 4.
Phylogenetic signal detection in plant-associated LBD clusters. (A) Proportion of the significant phylogenetic signal among LBD clusters enriched in PAB-broad, PAB-phyto, and PAB-symb species within two thresholds (≥50%, ≥80%). The significance through a P value test with 100 iterations, P value ≥0.05 rejects the null hypothesis of a phylogenetic signal (see Materials and Methods). (B) LBD cluster 549 (in red) distributed according to the chemotactic species phylogeny (5,763 representative species). The green leaves of the tree represent the PAB species. DPS, δ, and P values for this LBD cluster are represented in the lower left box. (C) Phylogeny representation of LBD cluster 549, containing 27 LBD sequences distributed across 4 orders (numbered 1 to 4 in the tree). The domain architecture prediction is shown for each of the CRs.

