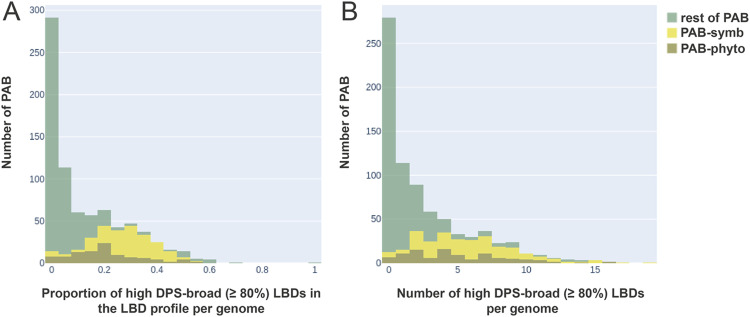
FIG 5.
Distribution of the high-plant-specificity LBDs in the PAB species profiles per genome. (A) Calculation of the proportion of high-DPS-broad (≥80%) LBDs in the total number of LBDs present in each species. The graph illustrates the distribution of the number of species according to the proportional ranges, plotting the species count as PAB-symb (yellow), PAB-phyto (brown), and the rest of PAB (green). (B) Absolute number of LBDs with a DPS-broad value of ≥80% in each PAB genome. The graph illustrates the distribution of the number of species as an absolute count of high-DPS LBD ranges. The species count is plotted as PAB-symb (yellow), PAB-phyto (brown), and the rest of PAB (green).

