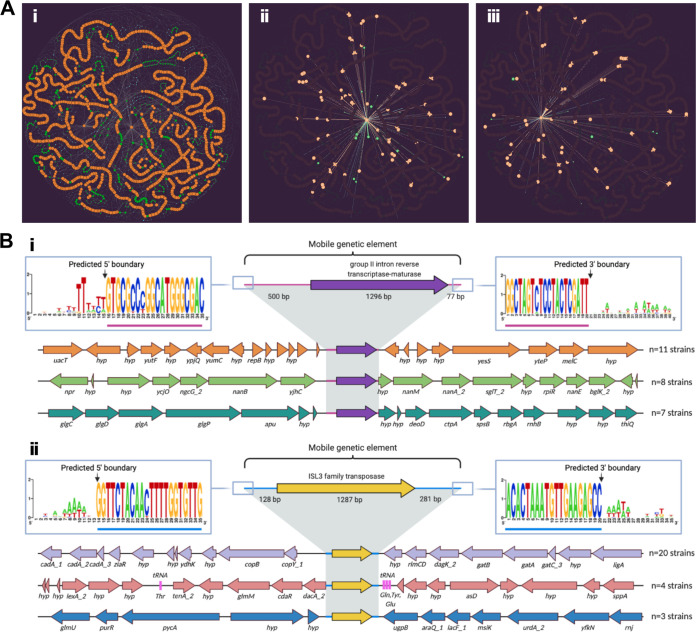
FIG 6.
D. pigrum genomes host a few highly prevalent MGEs. (Ai) On the PPanGGOLiN partitioned pangenome graph for the 28 D. pigrum genomes, we highlight the neighboring connections for the persistent GC of a predicted group II intron reverse transcriptase-maturase (Aii; purple in panel Bi) and a predicted ISL3 family transposase (Aiii; yellow in panel Bii). Each graph node corresponds to a GC; node size is proportional to the total number of genes in a given cluster; and node color represents PPanGGOLiN assignment of GCs to the partitions: persistent (orange), shell (green), and cloud (blue). Edges connect nodes that are adjacent in the genomic context and their thickness is proportional to the number of genomes sharing that neighboring connection. In panels Aii and Aiii, only the adjacent neighboring nodes and edges for each of the depicted GCs are contrast colored against the background pangenome graph. (B) Most common genomic neighborhoods for the predicted group II intron reverse transcriptase-maturase (Bi) and the ISL3 family transposase (Bii). OCTAPUS (https://github.com/FredHutch/octapus) identified the chromosomal coordinates of each MGE integration event in individual strains, and groupings of colocated genes residing within the same neighborhood structure across strains were visualized using Clinker (https://github.com/gamcil/clinker). ClustalOmega alignments of flanking regions across groupings revealed predicted terminal sequence boundaries (consistent 5′–3′ sequences across integration events) for each MGE. The three most common genomic loci for each MGE were rendered using BioRender.

