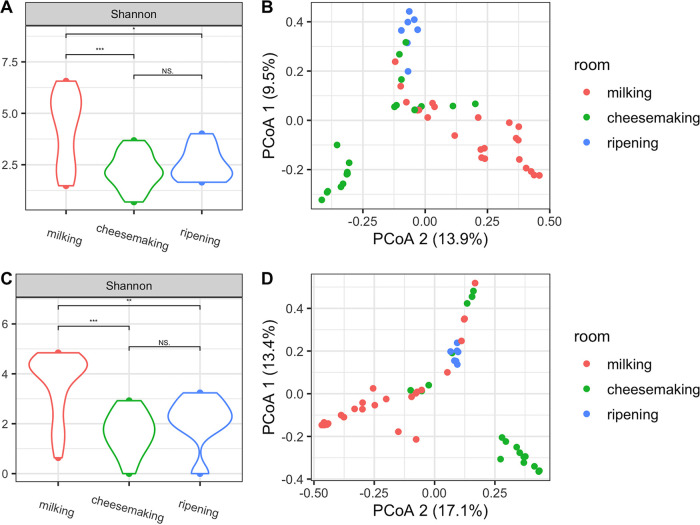
FIG 1.
Alpha diversity distributions of bacterial (A) and fungal (C) communities in environmental samples from the three processing rooms along the farmstead cheesemaking continuum. Levels of significance are indicated by asterisks: *, P < 0.05; **, P < 0.01; ***, P < 0.001. Principal coordinate analysis based on Bray-Curtis dissimilarity of bacterial (B) and fungal (D) communities in environmental samples.

