FIG 2.
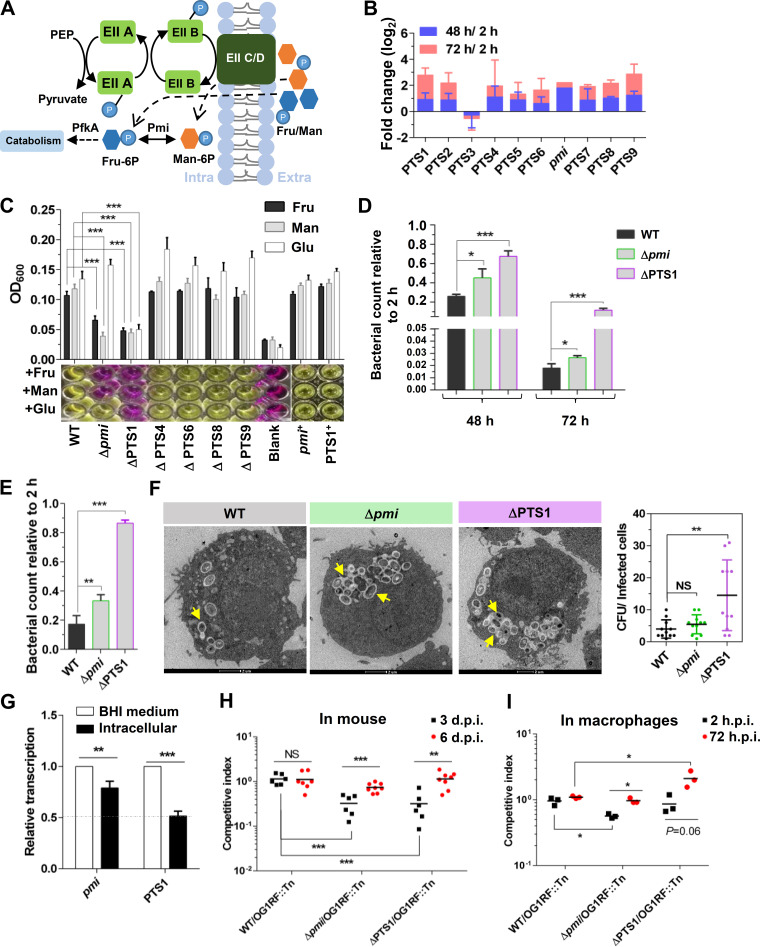
Carbohydrate metabolism affects E. faecalis survival in macrophages. (A) Schematic diagram of fructose (fru) and mannose (man) transport and metabolism in E. faecalis. (B) The fold change (log2) of fructose and mannose metabolism-related genes after survival in RAW264.7 cells for 48 h (blue) or 72 h (red). The initial data of this histogram are from the TIS results. (C) Growth of E. faecalis strains in DMEM. Sugar-free DMEM supplemented with fructose, mannose, or glucose was used to cultivate the strains. n ≥ 3; *, P < 0.05; ***, P < 0.001 (based on Student’s t test). (D and E) The survival of E. faecalis strains in RAW264.7 cells (D) or primary peritoneal macrophages (E) after 48 or 72 h of infection. The viable bacterial number at the indicated time was counted by plating. n ≥ 3; *, P < 0.05; ***, P < 0.001 (based on Student's t test). (F) Transmission electron microscopy (TEM) results showing the survival of the E. faecalis WT, Δpmi, and ΔPTS1 strains in RAW264.7 cells at 48 h.p.i. The yellow arrows indicate E. faecalis survival in phagosomes. The bacterial counts in infected cells were calculated. Representative images are shown. NS, no significant difference; **, P < 0.01 (based on one-way ANOVA). (G) qRT-PCR results showing the expression of PTS1 and pmi in RAW264.7 cells. The E. faecalis WT strain was cultured in BHI medium and survived in RAW264.7 cells for 24 h. n ≥ 3; ***, P < 0.001 (based on Student’s t test). (H andI) The competitive survival of E. faecalis strains in mice (H) and in primary peritoneal macrophages (I). WT, Δpmi, and ΔPTS1 cells were competed 1:1 versus a transposon mutant (insertion in OG1RF_12558 to OG1RF_12559), which was gentamicin resistant and used to distinguish the Δpmi and ΔPTS1 strains. Six or eight mice were used per group. n ≥ 3; **, P < 0.01; ***, P < 0.001; P values determined via ANOVA followed by Bonferroni’s multiple-comparison posttest.

