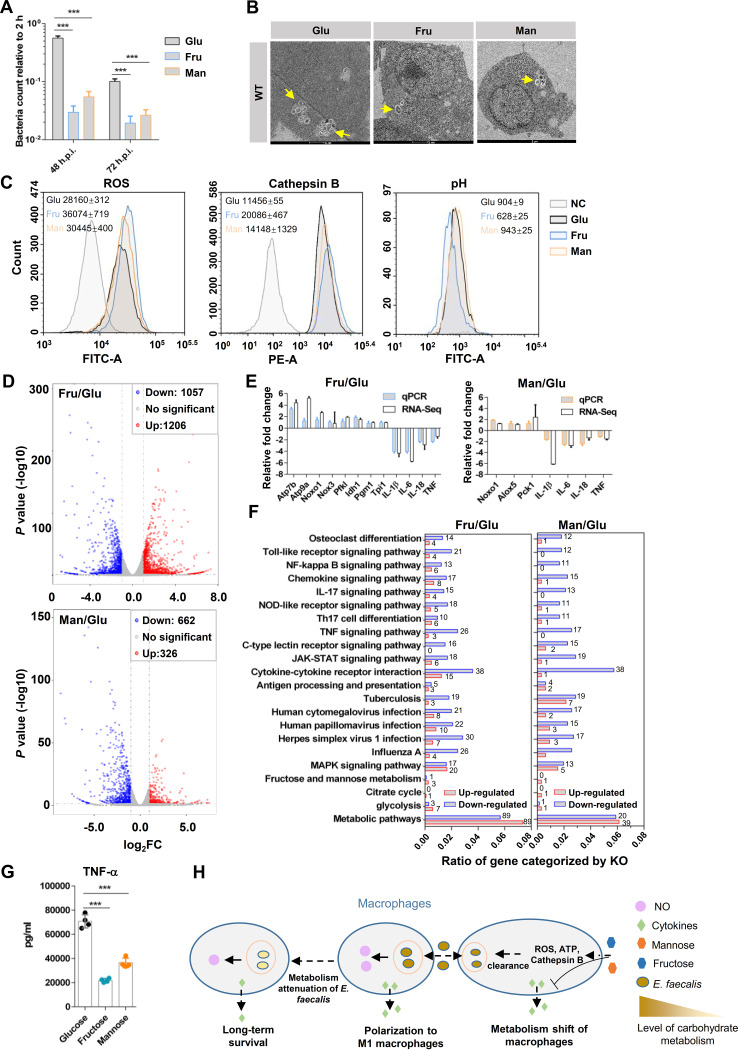
FIG 5.
Carbohydrate metabolism affects macrophage-mediated killing of E. faecalis. (A) Sugar shift affects macrophage-mediated killing of E. faecalis. After E. faecalis was internalized by RAW264.7 cells, the extracellular bacteria were killed by gentamicin and vancomycin, and the medium was simultaneously changed to fresh sugar-free DMEM supplemented with glucose, fructose, or mannose as the primary carbon resource. At 48 and 72 h postinfection, the viable bacteria in host cells were counted by plating. n ≥ 3; ***, P < 0.001 (based on the Student’s t test). (B) TEM analysis showed the status and bacterial number of the E. faecalis WT strain in RAW264.7 cells cultured with sugar-free DMEM supplemented with glucose, fructose, or mannose. Representative images are shown. (C) Flow cytometry analyses of the production of ROS, the activities of cathepsin B, and the acidification of E. faecalis-containing phagosomes in RAW264.7 cells. RAW264.7 cells were treated with different sugars (glucose, fructose, or mannose) and infected with E. faecalis. More than three independent biological replicates were performed. The mean fluorescein intensity (MFI) with standard deviation (SD) was calculated and is shown. (D) Volcano plots were utilized to analyze the RNA-Seq results. RAW264.7 cells treated with glucose, fructose, or mannose were subjected to RNA-Seq. Red dots and blue dots represent upregulation (log2FC, ≥1; P < 0.01) and downregulation (log2 FC, ≤−1; P < 0.01), respectively. Two independent biological replicates were performed. (E) Validation of RNA-Seq results by qRT-PCR. RAW264.7 cells were treated with glucose, fructose, and mannose after E. faecalis infection. The expression of genes in RAW264.7 cells treated with fructose and mannose compared to glucose is shown. Three independent biological replicates were performed. (F) KO categorization of genes with significant differences according to RNA-Seq results. The gene ratio represents the number of genes enriched by one category relative to all the significant genes counted. The number of depleted genes in each category is shown. (G) ELISA analyses of the secretion of TNF-α by RAW264.7 cells treated with glucose, fructose, and mannose after E. faecalis infection. n ≥ 3; ***, P < 0.001 (based on Student’s t test). (H) Schematic diagram shows carbohydrate metabolism coordinating the survival of E. faecalis in macrophages. Macrophages sense the stimulation of carbohydrate metabolism or metabolites from E. faecalis and polarize to M1 to induce the production of NO for bacterial killing. On the other hand, the shift in carbohydrate metabolism affects macrophage-mediated killing of E. faecalis and inflammation.

