
FIG 4.
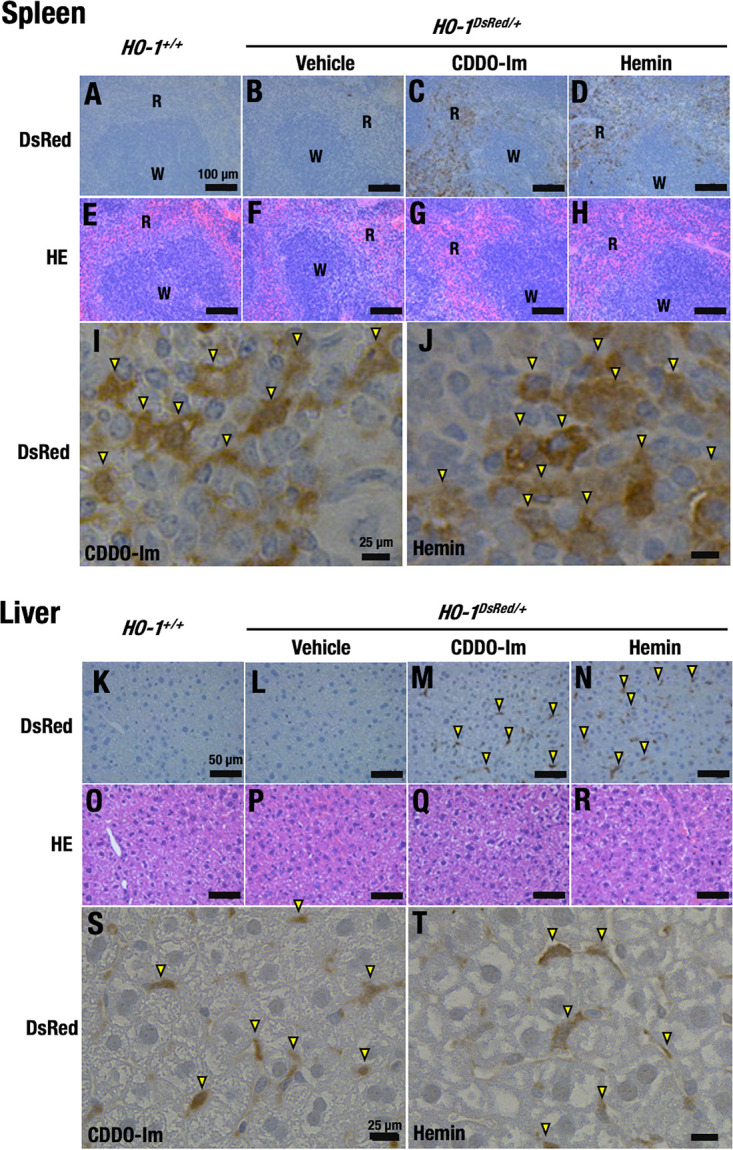
CDDO-Im and hemin induce HO-1–DsRed expression in the spleens and livers of HO-1DsRed/+ mice. Shown are representative DsRed immunostaining images (A to D, I, J, K to N, S, and T) and HE staining images (E to H and O to R) of the spleens (A to J) and livers (K to T) of HO-1+/+ mice (A, E, K, and O) and HO-1DsRed/+ mice (B to D, F to H, I, J, L to N, P to R, S, and T) treated with 10 μmol/kg BW CDDO-Im (C, G, I, M, Q, and S), 30 mg/kg hemin (D, H, J, N, R, and T), or vehicle (B, F, L, and P) for 72 h. Scale bars, 100 μm (A to H), 50 μm (K to R), and 25 μm (I, J, S, and T). W and R indicate white pulp and red pulp of the spleen, respectively. Note that red pulp macrophages in the spleen and Kupffer cells in the liver are immunostaining positive. Arrowheads indicate DsRed-positive cells in spleen and liver.