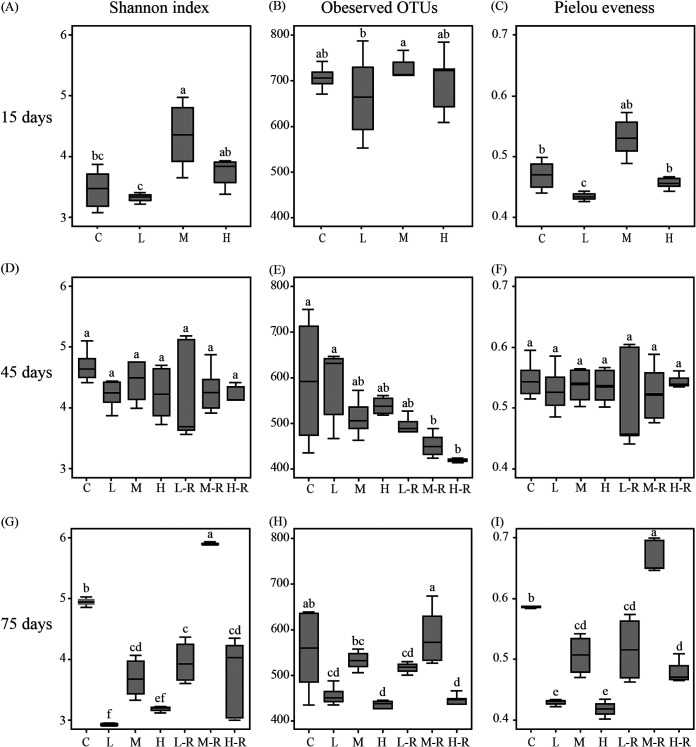
FIG 2.
Box plot of Shannon index (A, D, G), observed OTUs (B, E, H), and Pielou evenness index (C, F, I) of gut microbiota in zebrafish after AgNP exposure. Different lowercase letters indicate significant differences (ANOVA, P < 0.05) among groups. C, control; L, M, and H, exposure to low (10 μg/liter), medium (33 μg/liter), and high (100 μg/liter) concentrations of AgNPs, respectively; L-R, M-R, and H-R, recovery from exposure to low (10 μg/liter), medium (33 μg/liter), and high (100 μg/liter) concentrations of AgNPs, respectively. Data are the mean ± standard error (n = 6).

