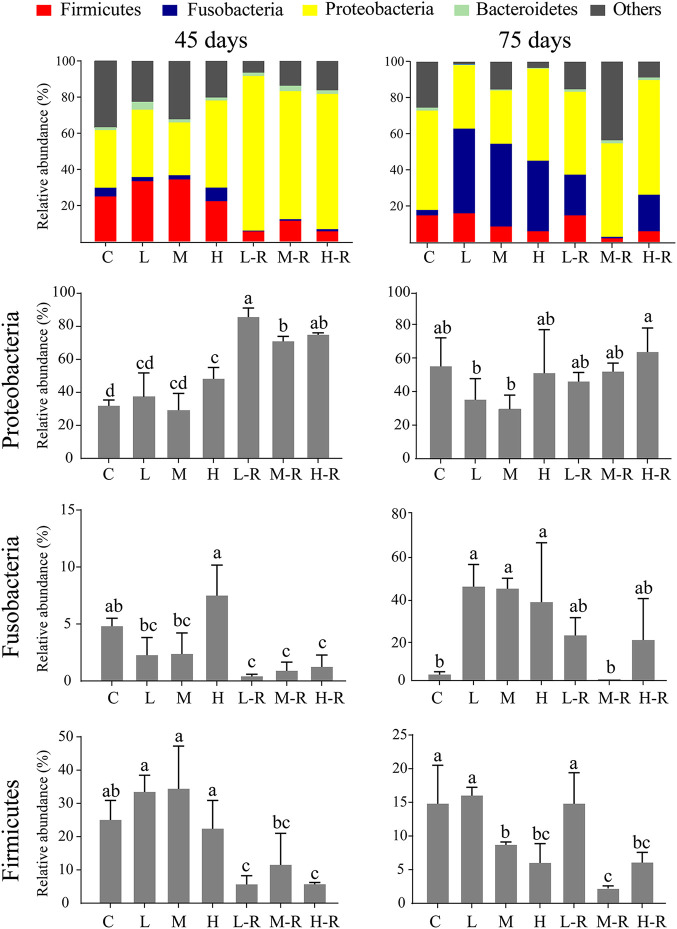
FIG 4.
Relative abundances of the dominant phyla of zebrafish gut microbiota at 45 days (left panel) and 75 days (right panel). Different lowercase letters above the bars indicate significant differences among groups (ANOVA, P < 0.05), whereas the same letter suggests no significant difference. Data are the mean ± standard error (n = 6).

