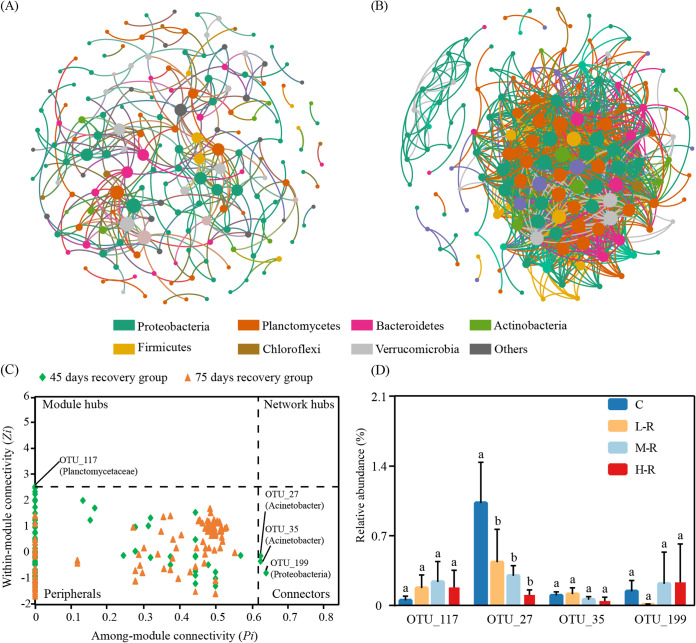
FIG 7.
Correlation-based networks of zebrafish gut microbial OTUs in the 45-day (A) and 75-day (B) recovery groups. Zi-Pi plots show the distribution of OTUs based on their topological roles (C) and the abundance of potential keystone OTUs (D). Each node represents an OTU, and threshold values of Zi and Pi for categorizing OTUs were 2.5 and 0.62, respectively.

