FIG 2.

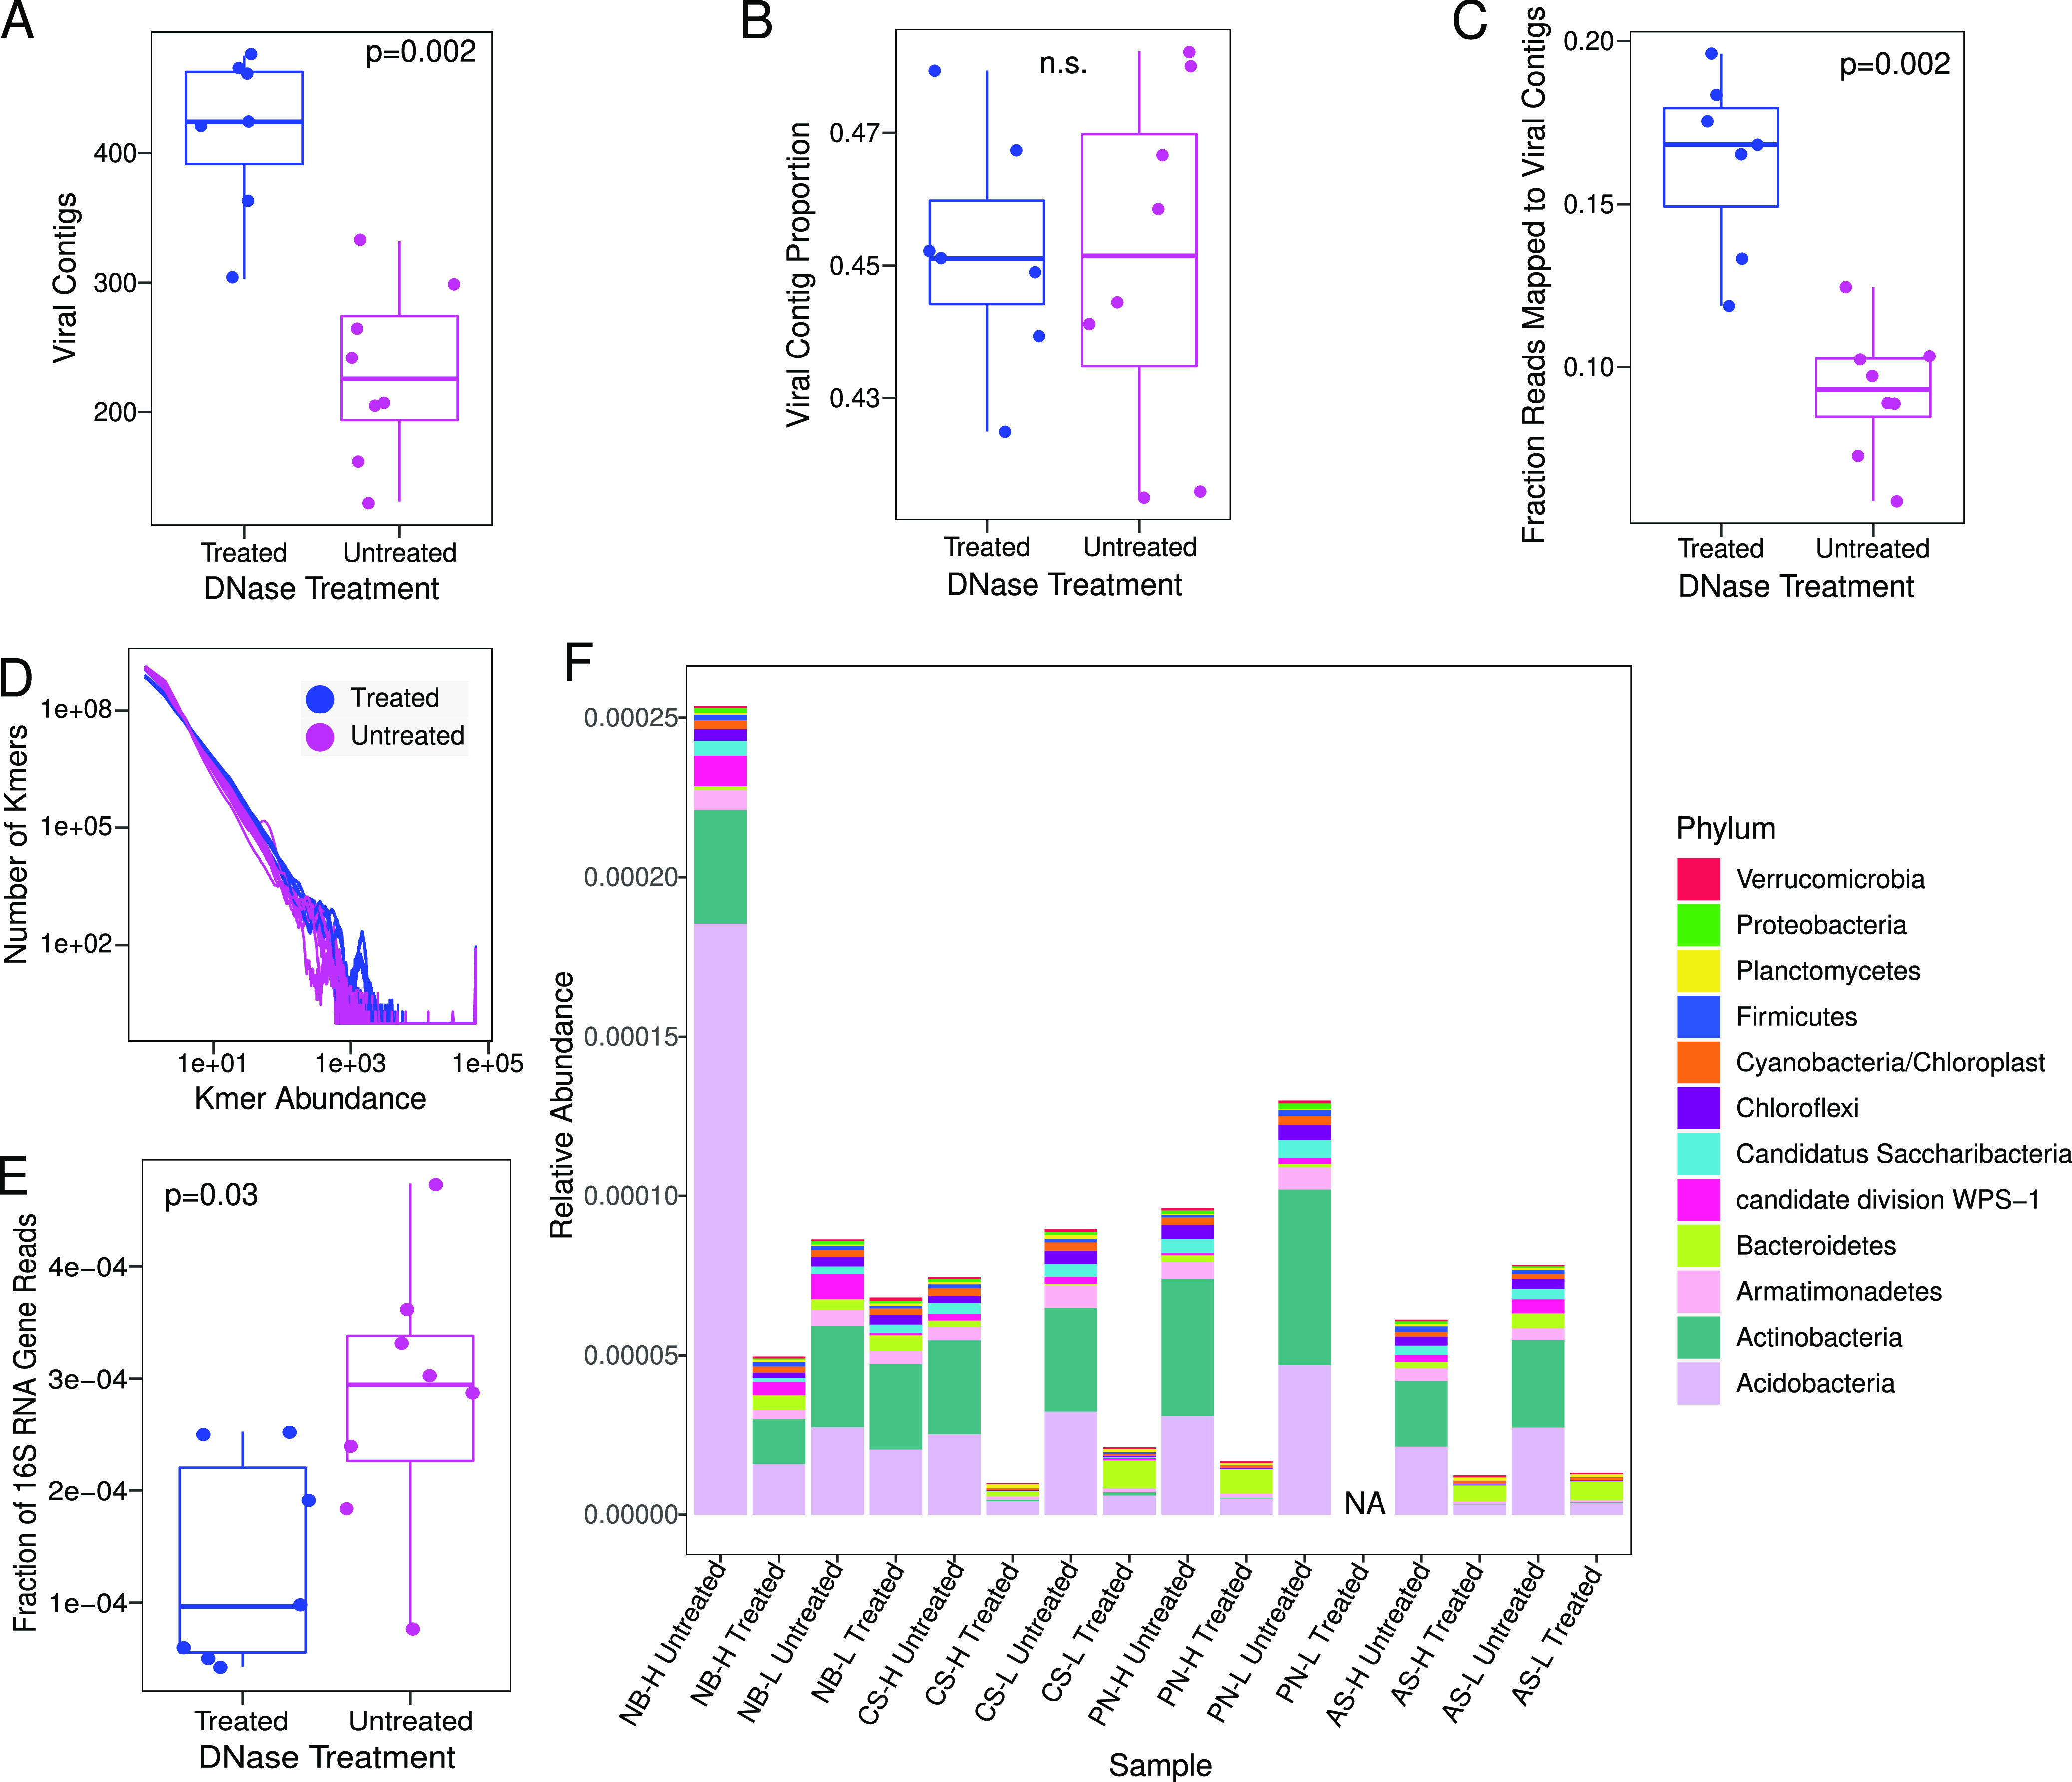
Differences in sequencing contents between DNase-treated and untreated viromes. (A and B) Number of VirSorter-identified viral contigs assembled per virome (A) and their proportion of the total number of contigs per virome (B). (C) Proportion of reads from each sample that mapped to VirSorter-identified viral contigs. (D) Frequency plot of k-mers showing k-mer abundance on the x axis and the number of k-mers with that abundance on the y axis. Each line is one virome. (E) Proportion of reads that contain partial 16S rRNA gene sequences as identified via SortMeRNA. (F) Relative abundances of the top 12 most abundant phyla according to partial 16S rRNA gene sequences. The y axis displays the number of reads containing 16S rRNA gene fragments from each of the top 12 phyla as a proportion of the total number of quality-trimmed reads in each virome. DNase-treated and untreated viromes from the same plot are placed next to each other for ease of comparison. NA, not applicable (no data). For all box plots (A to C and E), boxes show the interquartile ranges and median values, with whiskers extending to the furthest nonoutlying data point, and P values show the significance of Kruskal-Wallis tests between DNase-treated (n = 7) and untreated (n = 8) viromes. Insignificant results (P values of >0.05) are indicated as n.s. (not significant).
