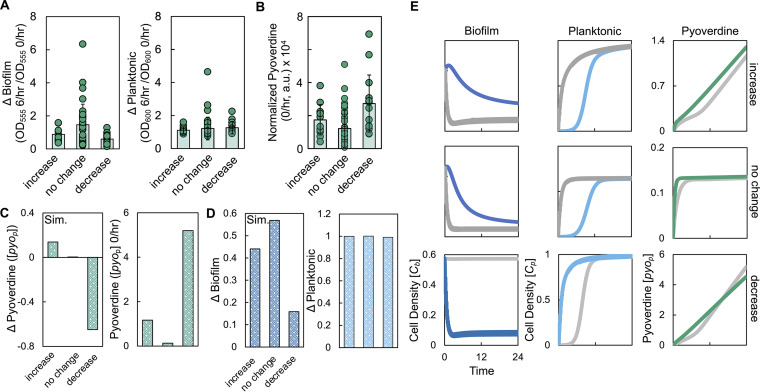
FIG 5.
Changes in the density of the biofilm can account for the increase, decrease, or lack of change in the amount of pyoverdine as a result of periodic disturbance. (A) Experimental Δbiofilm (left panel, P = 0.017, Kruskal-Wallis) and Δplanktonic (right panel, P = 0.2187, Kruskal-Wallis, Shapiro-Wilk, P < 0.0001) values due to periodic disturbance at 6/h. Standard deviations from six biological replicates were determined. (B) Amounts of normalized pyoverdine produced in the 0/h condition grouped by strains that had an increase, no change, or a decrease at 6/h compared to 0/h (P = 0.0011, Kruskal-Wallis, Shapiro-Wilk, P < 0.0001). (C, left) Simulations showing the difference in pyoverdine between 0/h and 6/h for different pyoverdine synthesis rates. (C, right) Simulations showing the final amount of pyoverdine in the 0/h condition for different pyoverdine synthesis rates. For panels C to E, we used equations 5 to 8. Parameter values, including initial biofilm densities and pyoverdine synthesis rates, are provided in Table S3. t = 24 h. General trends in panels C to E can be found over longer simulation times (see Fig. S6B) and over a range of parameter values (see Fig. S7). For all panels, Sim. = simulation results. (D) Simulated Δbiofilm (left) and Δplanktonic (right) values. (E) Simulations showing the temporal changes in the density of bacteria in the biofilm (left) and planktonic states (center), as well as the amount of pyoverdine (right), for each pyoverdine synthesis rate.

