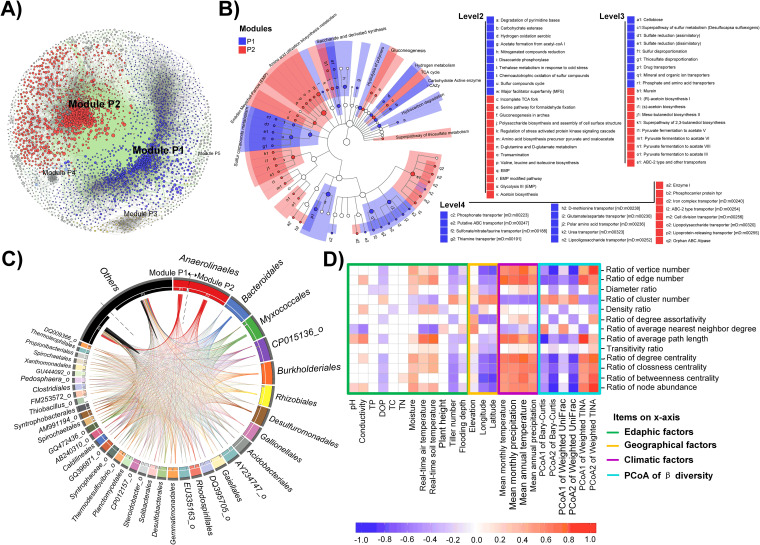
FIG 5.
Comparison of the two major modules derived from paddy soil bacterial networks highlights their respective taxonomic members and functional potentials. (A) Cooccurrence network with nodes colored according to the top five modules (ranked by node numbers). The nodes represent OTUs. The size of the node is proportional to the base-10 logarithm of the abundance of the OTU, normalized by averaging the values of each region for each soil type. A connection between two nodes means that there is a strong and significant (P < 0.001) correlation between each OTU pair. The edge color indicates positive (gray) or negative (green) correlations. (B) LEfSe showing functional differences between module P1 and module P2. Functions enriched in module P1 are colored in blue, and those enriched in module P2 are colored in red. The functions were searched against the FOAM database and have been classified into four levels. See Fig. 2C for details. (C) Taxonomic comparisons between modules P1 and P2 using circo plots at the order level. The size of the segment is proportional to the relative abundance of the order normalized by averaging the values of each region, and the size of the ribbon is proportional to the number of links (copresence and exclusion). The orders shown here are present in both modules. (D) Heatmap of Spearman’s rank correlation coefficients between module P1 to P2 index ratios (y axis) and environmental factors or the first two PCoA axes based on bacterial community composition (x axis).

