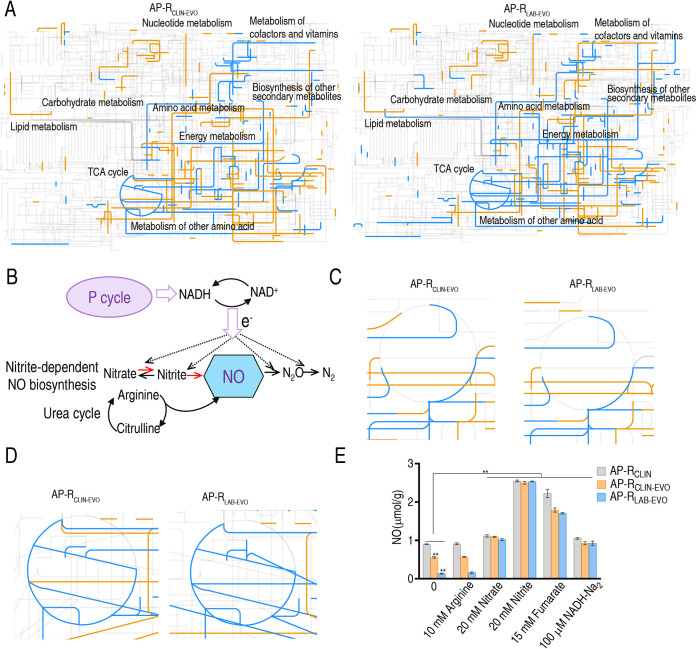
FIG 4.
iPath analysis and measurement of NO. (A) iPath analysis. (B) Outline for NO biosynthesis. The dotted line represents the direction of electron transfer. (C) Enlarged map for urea cycle based on data in panel A. (D) Enlarged map for TCA cycle based on data in panel A. (E) NO level in the absence or presence of arginine, fumarate, nitrate, and nitrite. Results are displayed as means ± SEM, and significant differences as determined by two-tailed Student’s t test are identified (*, P < 0.05; **, P < 0.01).

