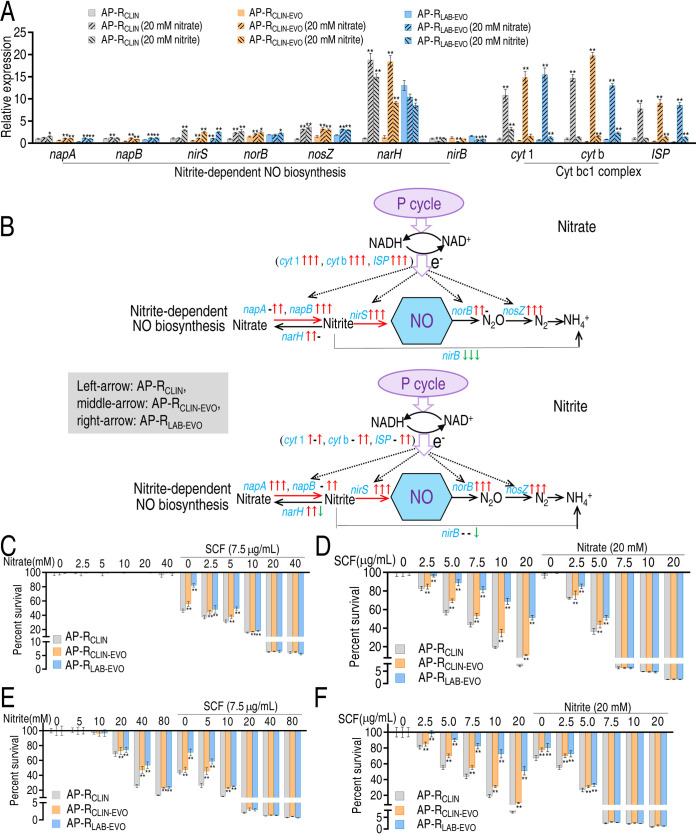
FIG 7.
Effect of nitrite-based NO biosynthesis on SCF-mediated killing. (A) qRT-PCR for expression of genes encoding nitrate-based NO biosynthesis enzymes in the presence of nitrate or nitrite. (B) Outline for changes in gene expression of NO biosynthesis based on data in panel A in the presence of nitrate or nitrite. The down arrow represents downregulation, and the up arrow represents upregulation. The left arrow and right arrow represent AP-CLIN-EVO and AP-LAB-EVO, respectively. The black arrow shows the same changes in gene expression in the presence of nitrate or nitrite; the purple arrow represents changes in gene expression only in the presence of NaNO3. Blue is used for gene names not found. (C and D) Percent survival of the three strains at the indicated concentrations of nitrate (C) and SCF (D). (E and F) Percent survival of the three strains at the indicated concentrations of nitrite (E) and SCF (F). Results in panels A and C to F are displayed as means ± SEM, and significant differences as determined by two-tailed Student’s t test are identified (*, P < 0.05; **, P < 0.01).

