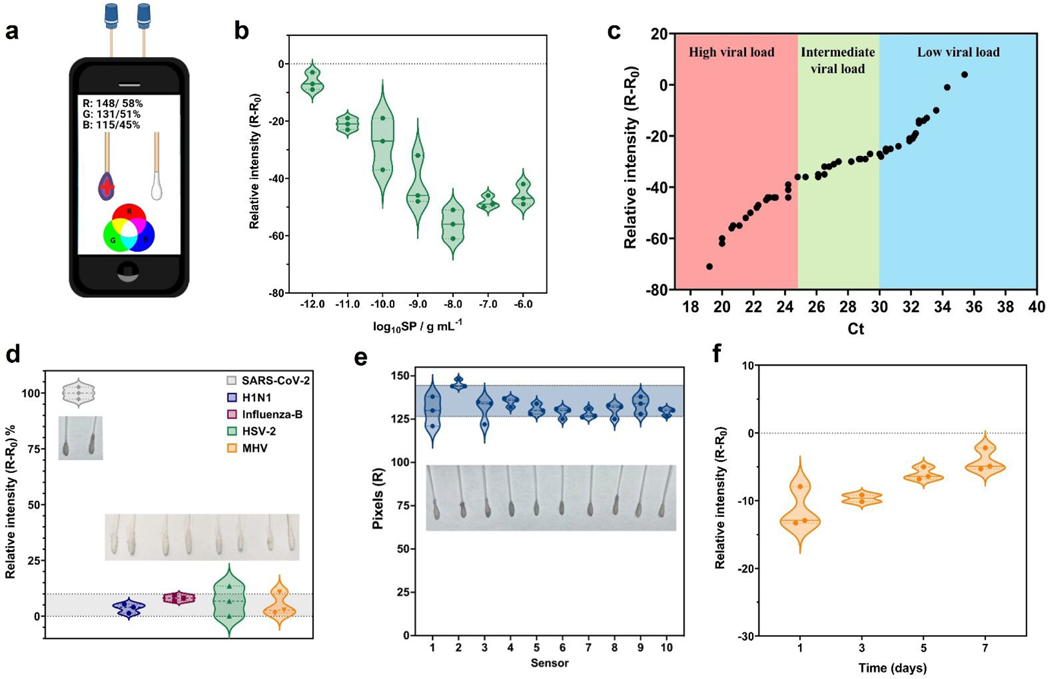
Figure 3. Analytical parameters of COLOR obtained using a free app and a smartphone.
(a) Image of the acquisition process of the color patterns from colorimetric cotton swabs biosensor using RGB app on the smartphone. (b) Analytical curve built using SP at concentrations ranging from 1×10⁻¹² g mL−1 to 1×10⁻⁶ g mL−1, with a linear behavior in the concentration ranging from 1×10⁻¹² g mL−1 to 1×10⁻⁸ g mL−1 SP. (c) Comparison of the relative red pattern intensity obtained with COLOR including Ct values (ranging from 19.2 Ct to 35.4 Ct) from RT-PCR for all SARS-CoV-2 positive samples tested in this study. (d) Selectivity studies using other coronaviruses and non-coronavirus strains; H1N1-A/California/2009 (105 PFU mL−1); Influenza-B/Colorado (105 PFU mL−1); Herpes simplex virus-2 (108 PFU mL−1) and MHV-murine hepatitis virus (108 PFU mL−1). Each virus was incubated in a final volume of 200 μL for 1 min at room temperature. (e) Reproducibility studies were carried out using 10 modified cotton swabs incubated for 1 min in the presence of 1×10⁻⁹ g mL−1 SP, resulting in a relative standard deviation (RSD) of 5.70%. (f) Stability study of COLOR. The cotton swabs were stored at 4 °C in PBS medium (pH = 7.4) over 7 days with the best results obtained until 3 days. Sensitivity values were obtained through analytical curves generated at concentrations ranging between 1×10⁻¹² g mL−1 to 1×10⁻⁹ g mL−1 SP.
All experiments were carried out in triplicate (n = 3 biosensors).

