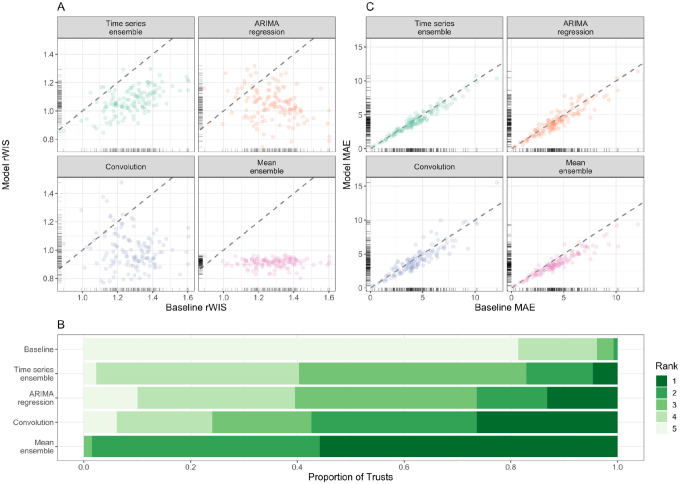
Figure 4: Forecasting accuracy by location (7-day forecast horizon).
(A) Relative WIS values of each model (y-axis) compared to the baseline model of no change (x-axis). Ticks on axes show the unilateral distribution of rWIS values. Dashed grey line shows y=x, for reference: a point below the line indicates that the model outperformed the baseline model by rWIS for that Trust. (B) Distribution of WIS rankings across all 129 NHS Trusts; rank 1 is assigned the model with the lowest relative WIS for a given scenario, and rank 5 to the highest relative WIS. (C) Mean absolute error of each model (y-axis) compared to the baseline model (x-axis). Ticks on axes show the unilateral distribution of MAE values. Dashed grey line shows y=x, for reference: a point below the line indicates that the model outperformed the baseline model by MAE for that Trust. All panels are for a 7-day forecast horizon; see Additional file 1: Figure S6 for evaluation on a 14-day forecast horizon.

