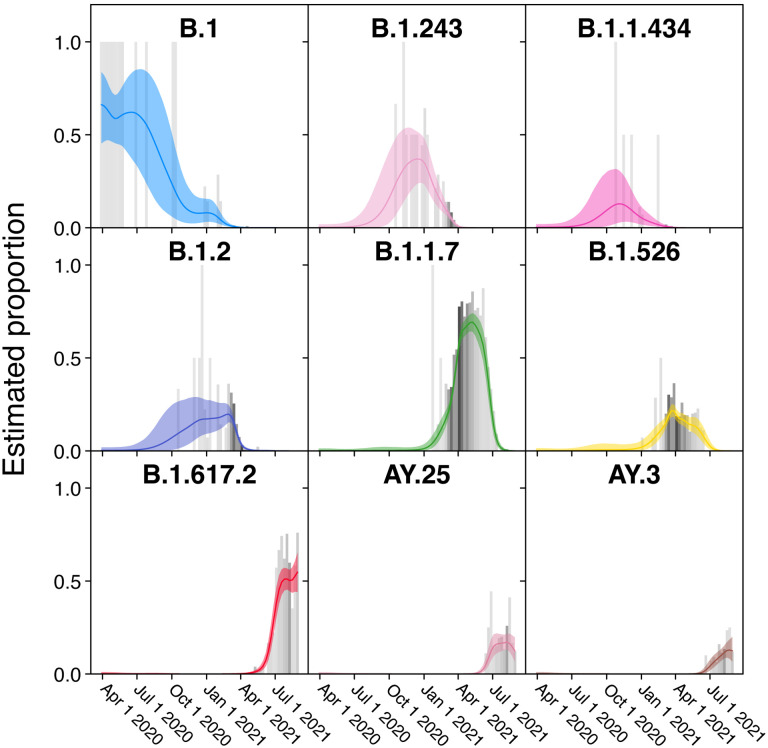
Figure 3.
Frequencies of individual variants estimated using Bayesian autoregressive moving average multinomial logistic regression. Time is shown along the x-axis and estimated proportions of the surveillance population along the y-axis. The grey bars indicate raw proportions from the count data shaded by the number of observations observed in a given week (darker indicating more samples) while the colored lines indicate the proportion estimated by the Bayesian model. The light colored envelopes around each line show the 95% credible intervals for the proportion. Only lineages achieving an estimated proportion of >10% in any given week are shown.

