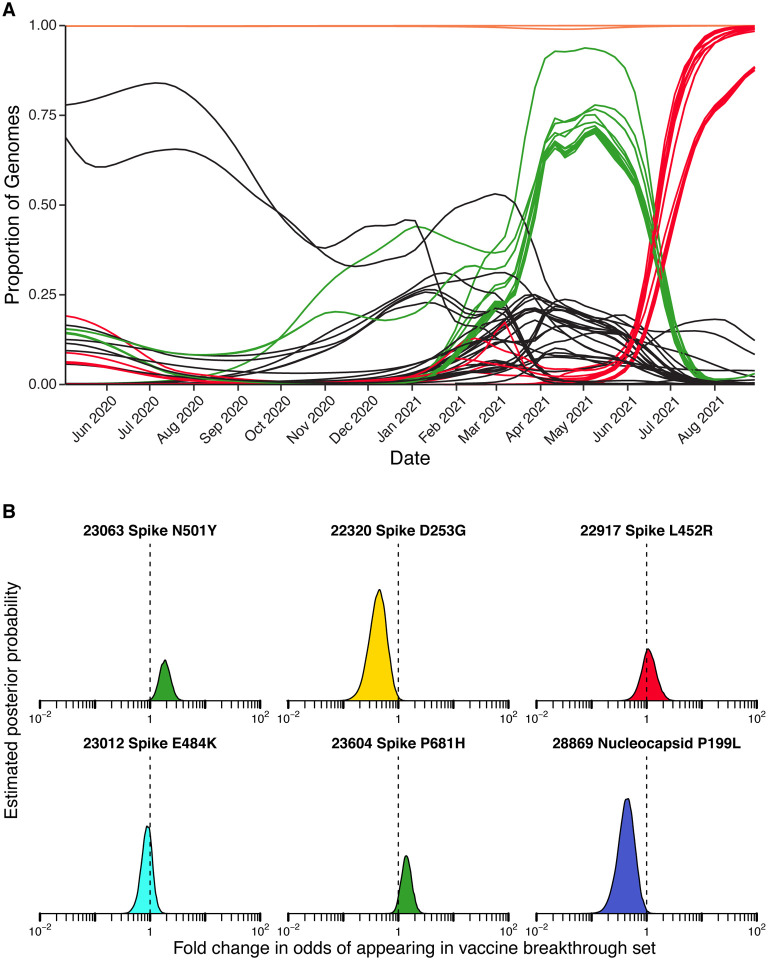
Figure 6.
Assessment of enrichment of specific base substitutions and deletions in vaccine breakthrough samples. A) Longitudinal frequencies of individual mutations estimated using Bayesian autoregressive moving average logistic regression models. Red indicates mutations commonly found in delta lineages. Green indicates mutations commonly found in alpha lineages. Orange indicates mutations shared by almost all lineages in the study. Black indicates mutations found in other subsets of lineages. B) Estimated posterior probability densities summarizing the fold enrichment/depletion in odds of a mutation appearing in the vaccine breakthrough samples over its proportions estimated from surveillance samples. The mutations estimated as most enriched and most depleted are shown along with other mutations of interest. Markings as in Figures 4 and 5.

